Logs and relabeling basics in Grafana Alloy
This tutorial covers some basic metric relabeling, and shows you how to send logs to Loki.
Before you begin
To complete this tutorial:
- You must complete the First components and the standard library tutorial.
Relabel metrics
Now that you have built a basic pipeline and scraped some metrics, you can use the prometheus.relabel component to relabel metrics.
Recommended reading
- Optional:
prometheus.relabel
Add a prometheus.relabel component to your pipeline
The prometheus.relabel component allows you to perform Prometheus relabeling on metrics and is similar to the relabel_configs section of a Prometheus scrape configuration.
Add a prometheus.relabel component to a basic pipeline and add labels.
prometheus.exporter.unix "localhost" { }

prometheus.scrape "default" {
    scrape_interval = "10s"

    targets    = prometheus.exporter.unix.localhost.targets
    forward_to = [
        prometheus.relabel.example.receiver,
    ]
}

prometheus.relabel "example" {
    forward_to = [
        prometheus.remote_write.local_prom.receiver,
    ]

    rule {
        action       = "replace"
        target_label = "os"
        replacement  = constants.os
    }
}

prometheus.remote_write "local_prom" {
    endpoint {
        url = "http://localhost:9090/api/v1/write"
    }
}
You have created the following pipeline:
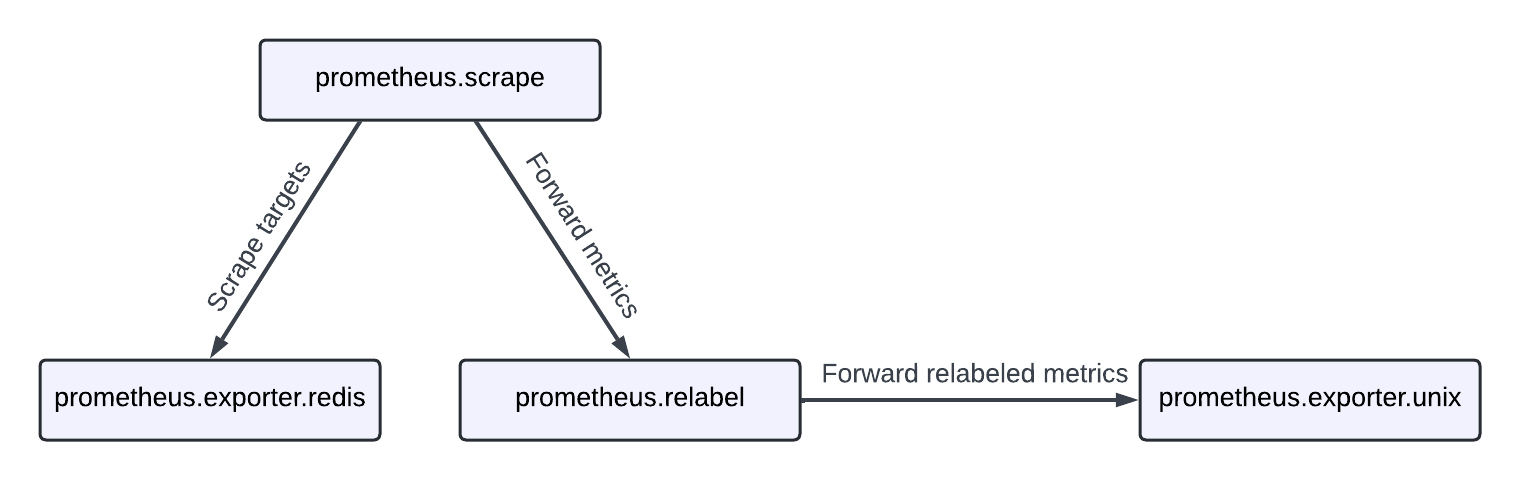
This pipeline has a prometheus.relabel component that has a single rule.
This rule has the replace action, which replaces the value of the os label with a special value: constants.os.
This value is a special constant that’s replaced with the OS of the host Alloy is running on.
You can see the other available constants in the constants documentation.
This example has one rule block, but you can have as many as you want.
Each rule block is applied in order.
Note
Multiple
keeprules are applied sequentially. If a target fails the firstkeep, it’s dropped immediately, so two separatekeeprules act like a logical AND. To implement OR logic across multiple criteria, you can combine them in one rule using multiplesource_labelsand a compound regular expression.The following example demonstrates how you can implement OR in one rule:
rule {
 source_labels = ["__meta_kubernetes_pod_annotation_A", "__meta_kubernetes_pod_label_B"]
 regex         = "(true;.*|.*;true)"
 action        = "keep"
}
If you run Alloy and navigate to http://localhost:3000/explore, you can see the os label on the metrics.
Try querying for node_context_switches_total and look at the labels.
Relabeling uses the same rules as Prometheus. You can always refer to the prometheus.relabel rule-block documentation for a full list of available options.
Note
You can forward multiple components to one
prometheus.relabelcomponent. This allows you to apply the same relabeling rules to multiple pipelines.
Warning
There is an issue commonly faced when relabeling and using labels that start with
__(double underscore). These labels are considered internal and are dropped before relabeling rules from aprometheus.relabelcomponent are applied. If you would like to keep or act on these kinds of labels, use adiscovery.relabelcomponent.
Send logs to Loki
Now that you’ve created components and chained them together, you can collect some logs and send them to Loki.
Recommended reading
- Optional:
local.file_match - Optional:
loki.source.file - Optional:
loki.write
Find and collect the logs
You can use the local.file_match component to perform file discovery, the loki.source.file to collect the logs, and the loki.write component to send the logs to Loki.
Before doing this, make sure you have a log file to scrape.
You can use the echo command to create a file with some log content.
mkdir -p /tmp/alloy-logs
echo "This is a log line" > /tmp/alloy-logs/log.log
Now that you have a log file, you can create a pipeline to scrape it.
local.file_match "tmplogs" {
    path_targets = [{"__path__" = "/tmp/alloy-logs/*.log"}]
}

loki.source.file "local_files" {
    targets    = local.file_match.tmplogs.targets
    forward_to = [loki.write.local_loki.receiver]
}

loki.write "local_loki" {
    endpoint {
        url = "http://localhost:3100/loki/api/v1/push"
    }
}
The rough flow of this pipeline is:
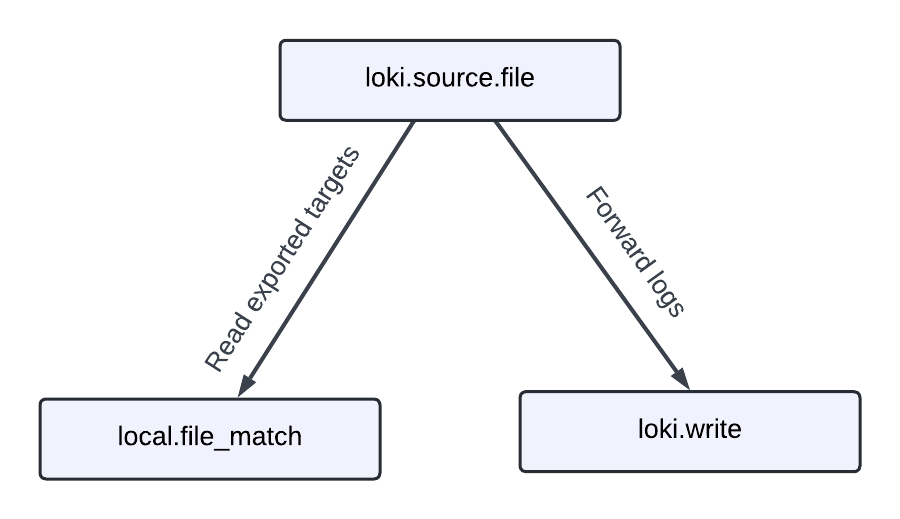
If you navigate to http://localhost:3000/explore and switch the data source to Loki, you can query for {filename="/tmp/alloy-logs/log.log"} and see the log line you created earlier.
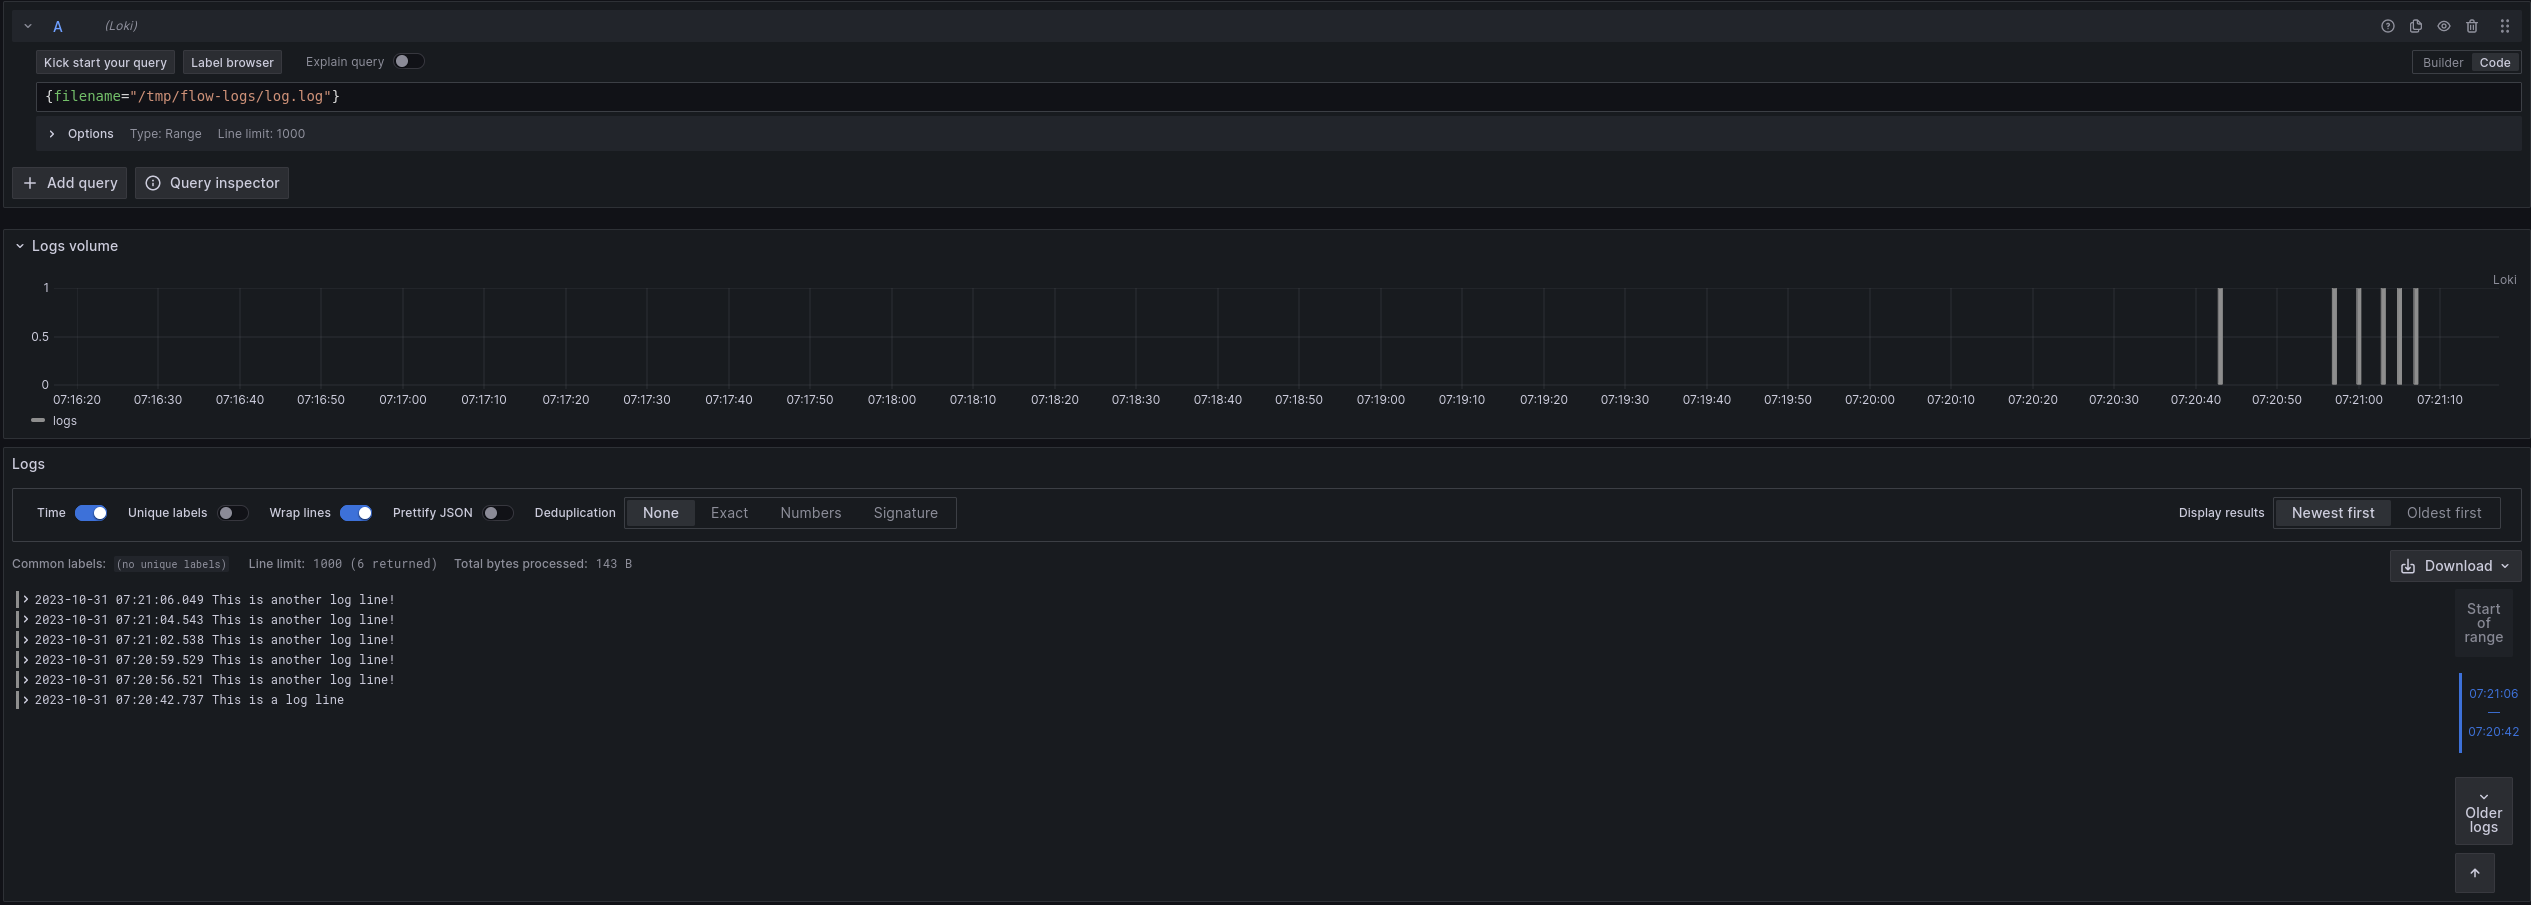
Try running the following command to add more logs to the file.
echo "This is another log line!" >> /tmp/alloy-logs/log.logIf you re-execute the query, you can see the new log lines.
If you are curious how Alloy keeps track of where it’s in a log file, you can look at data-alloy/loki.source.file.local_files/positions.yml.
If you delete this file, Alloy starts reading from the beginning of the file again, which is why keeping the Alloy’s data directory in a persistent location is desirable.
Exercise
The following exercise guides you through adding a label to the logs, and filtering the results.
Recommended reading
Add a Label to Logs
This exercise has two parts, and builds on the previous example.
Start by adding an os label (just like the Prometheus example) to all of the logs you collect.
Modify the following snippet to add the label os with the value of the os constant.
local.file_match "tmplogs" {
    path_targets = [{"__path__" = "/tmp/alloy-logs/*.log"}]
}

loki.source.file "local_files" {
    targets    = local.file_match.tmplogs.targets
    forward_to = [loki.write.local_loki.receiver]
}

loki.write "local_loki" {
    endpoint {
        url = "http://localhost:3100/loki/api/v1/push"
    }
}
Tip
You can use the
loki.relabelcomponent to relabel and add labels, just like you can with theprometheus.relabelcomponent.
Run Alloy and execute the following:
echo 'level=info msg="INFO: This is an info level log!"' >> /tmp/alloy-logs/log.log
echo 'level=warn msg="WARN: This is a warn level log!"' >> /tmp/alloy-logs/log.log
echo 'level=debug msg="DEBUG: This is a debug level log!"' >> /tmp/alloy-logs/log.log
Navigate to http://localhost:3000/explore and switch the data source to Loki.
Try querying for {filename="/tmp/alloy-logs/log.log"} and see if you can find the new label.
Now that you have added new labels, you can also filter on them. Try querying for {os!=""}.
You should only see the lines you added in the previous step.
// Let's learn about relabeling and send logs to Loki!

local.file_match "tmplogs" {
    path_targets = [{"__path__" = "/tmp/alloy-logs/*.log"}]
}

loki.source.file "local_files" {
    targets    = local.file_match.tmplogs.targets
    forward_to = [loki.relabel.add_static_label.receiver]
}

loki.relabel "add_static_label" {
    forward_to = [loki.write.local_loki.receiver]

    rule {
        target_label = "os"
        replacement  = constants.os
    }
}

loki.write "local_loki" {
    endpoint {
        url = "http://localhost:3100/loki/api/v1/push"
    }
}
Extract and add a Label from Logs
Note
This exercise is more challenging than the previous one. If you are having trouble, skip it and move to the next section, which covers some of the concepts used here. You can always come back to this exercise later.
This exercise builds on the previous one, though it’s more involved.
Assume you want to extract the level from the logs and add it as a label. As a starting point, look at loki.process.
This component allows you to perform processing on logs, including extracting values from log contents.
Try modifying your configuration from the previous section to extract the level from the logs and add it as a label.
If needed, you can find a solution to the previous exercise at the end of the previous section.
Tip
The
stage.logfmtandstage.labelsblocks forloki.processmay be helpful.
Run Alloy and execute the following:
echo 'level=info msg="INFO: This is an info level log!"' >> /tmp/alloy-logs/log.log
echo 'level=warn msg="WARN: This is a warn level log!"' >> /tmp/alloy-logs/log.log
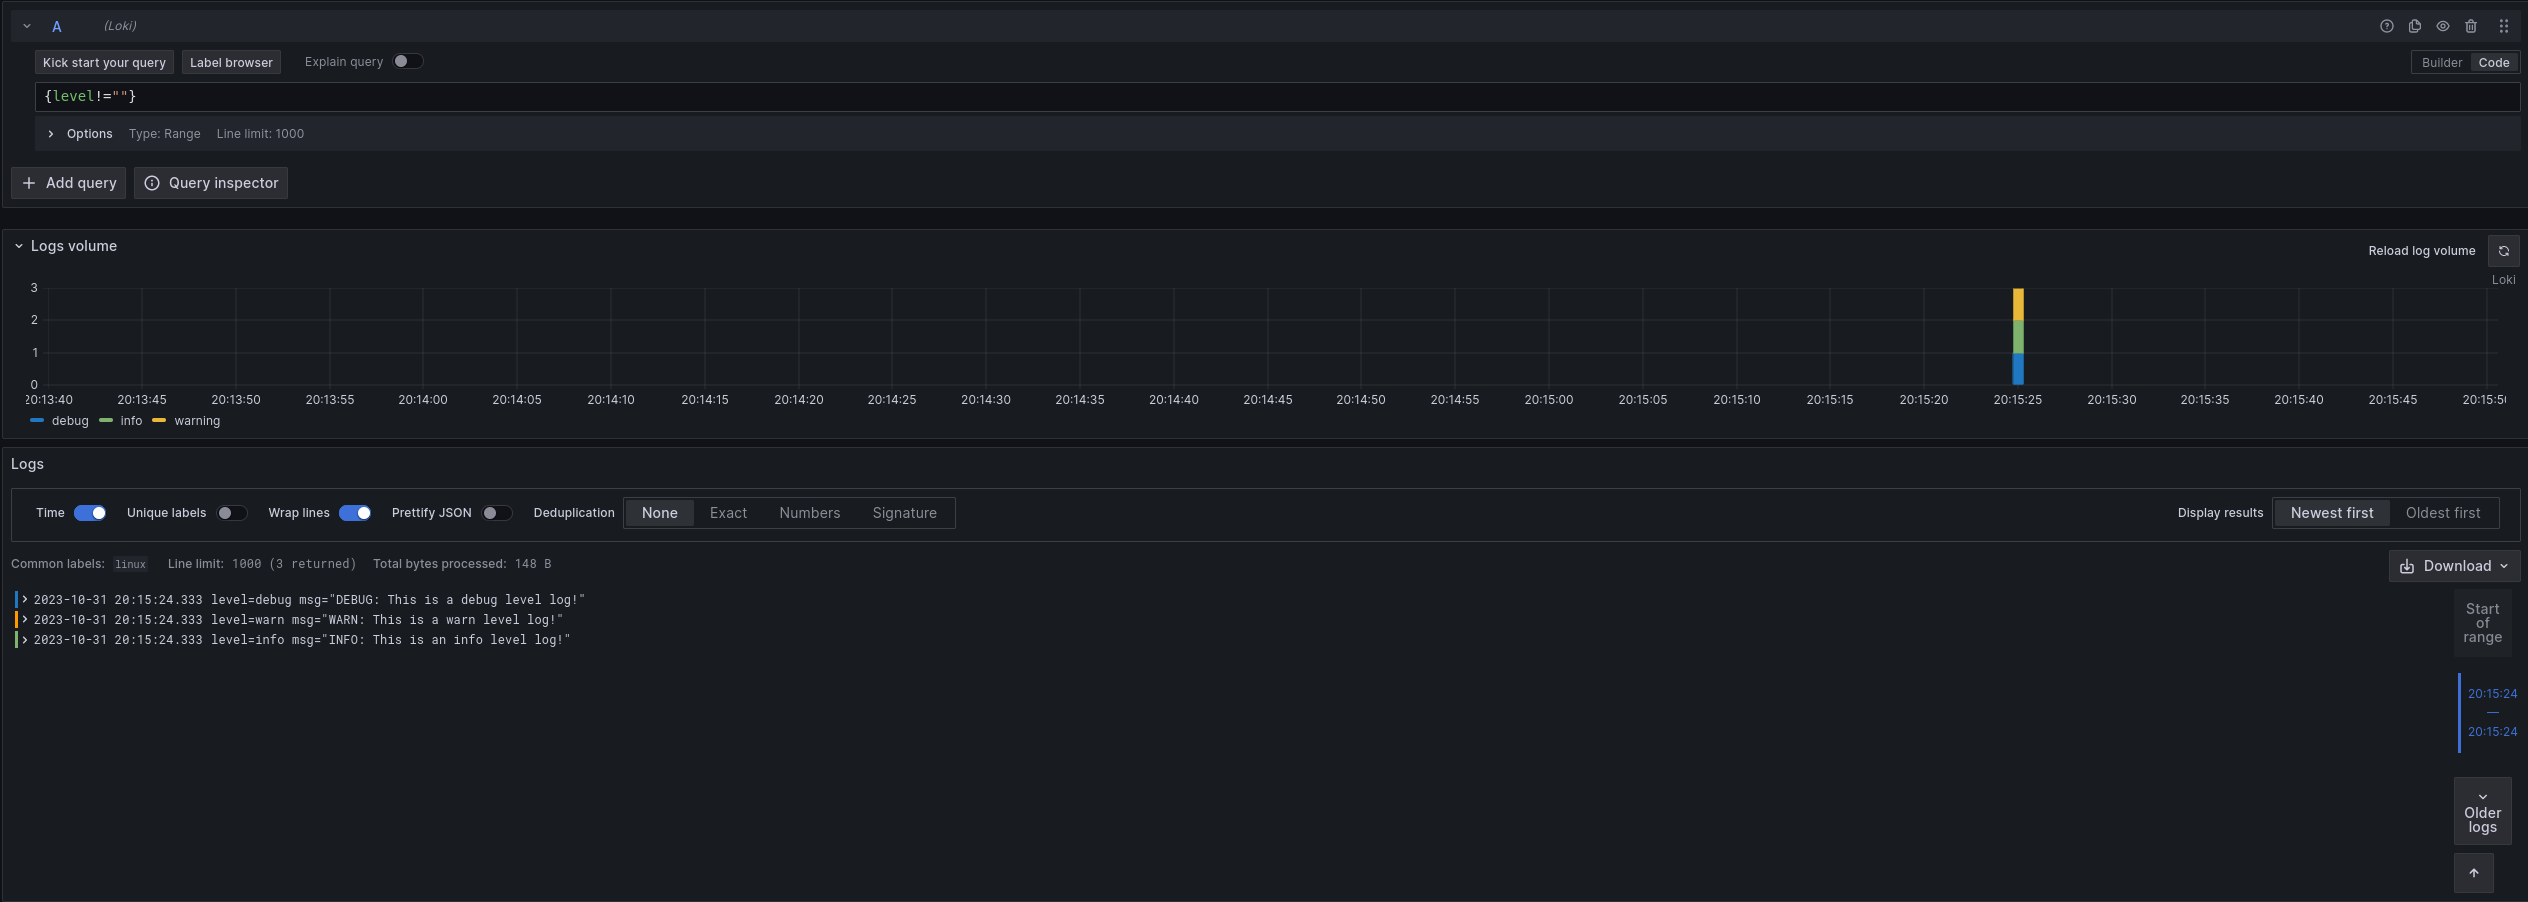
echo 'level=debug msg="DEBUG: This is a debug level log!"' >> /tmp/alloy-logs/log.logNavigate to http://localhost:3000/explore and switch the data source to Loki.
Try querying for {level!=""} to see the new labels in action.
// Let's learn about relabeling and send logs to Loki!

local.file_match "tmplogs" {
    path_targets = [{"__path__" = "/tmp/alloy-logs/*.log"}]
}

loki.source.file "local_files" {
    targets    = local.file_match.tmplogs.targets
    forward_to = [loki.process.add_new_label.receiver]
}

loki.process "add_new_label" {
    // Extract the value of "level" from the log line and add it to the extracted map as "extracted_level"
    // You could also use "level" = "", which would extract the value of "level" and add it to the extracted map as "level"
    // but to make it explicit for this example, we will use a different name.
    //
    // The extracted map will be covered in more detail in the next section.
    stage.logfmt {
        mapping = {
            "extracted_level" = "level",
        }
    }

    // Add the value of "extracted_level" from the extracted map as a "level" label
    stage.labels {
        values = {
            "level" = "extracted_level",
        }
    }

    forward_to = [loki.relabel.add_static_label.receiver]
}

loki.relabel "add_static_label" {
    forward_to = [loki.write.local_loki.receiver]

    rule {
        target_label = "os"
        replacement  = constants.os
    }
}

loki.write "local_loki" {
    endpoint {
        url = "http://localhost:3100/loki/api/v1/push"
    }
}
Finish up and next steps
You have learned the concepts of components, attributes, and expressions.
You have also seen how to use some standard library components to collect metrics and logs.
In the next tutorial, you learn more about how to use the loki.process component to extract values from logs and use them.


