
Overview
- Collect all your telemetry with one product
Choosing the right tools to collect, process, and export telemetry data can be a confusing and costly experience. The broad range of telemetry you need to process and the collectors you choose can vary widely depending on your observability goals. In addition, you face the challenge of addressing the constantly evolving needs of your observability strategy. For example, you may initially only need application observability, but you then discover that you must add infrastructure observability. Many organizations manage and configure multiple collectors to address these challenges, introducing more complexity and potential errors in their obervability strategy.
- All signals, whether application, infrastructure, or both
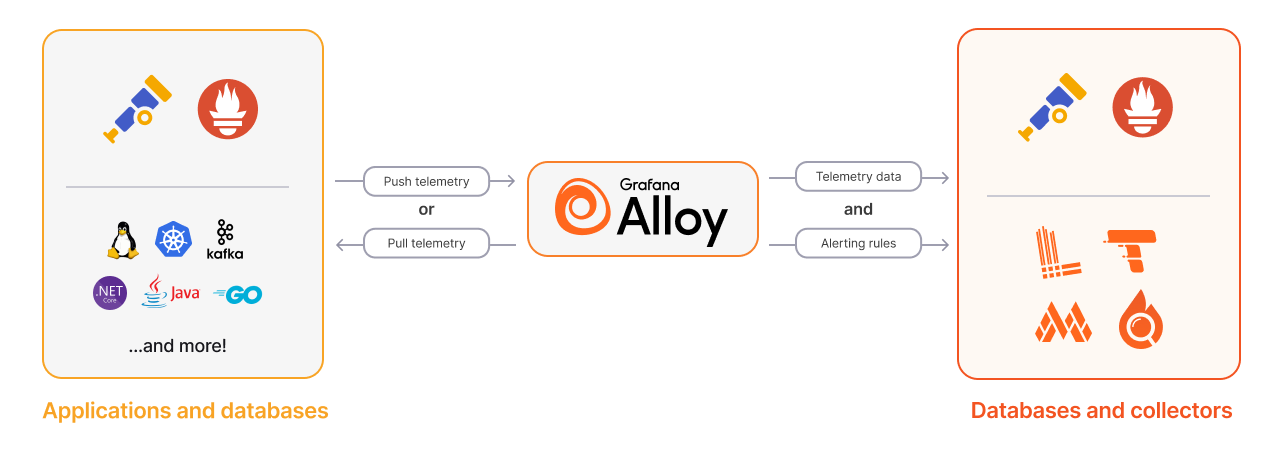
Grafana Alloy has native pipelines for leading telemetry signals, such as Prometheus and OpenTelemetry, and databases such as Loki and Pyroscope. This permits logs, metrics, traces, and even mature support for profiling.
- Enterprise strength observability
Grafana Alloy improves reliability and provides advanced features for Enterprise needs, such as clusters of fleets and balancing workloads. Grafana Fleet Management helps you manage multiple Grafana Alloy deployments at scale.
Explore
Was this page helpful?
Related resources from Grafana Labs


