
Caution
Grafana Alloy is the new name for our distribution of the OTel collector. Grafana Agent has been deprecated and is in Long-Term Support (LTS) through October 31, 2025. Grafana Agent will reach an End-of-Life (EOL) on November 1, 2025. Read more about why we recommend migrating to Grafana Alloy.
This is documentation for the next version of Grafana Agent Documentation. For the latest stable release, go to the latest version.
Debug Grafana Agent Flow
Follow these steps to debug issues with Grafana Agent Flow:
- Use the Grafana Agent Flow UI to debug issues.
- If the Grafana Agent Flow UI doesn’t help with debugging an issue, logs can be examined instead.
Grafana Agent Flow UI
Grafana Agent Flow includes an embedded UI viewable from the Grafana Agent HTTP server, which defaults to listening at http://localhost:12345.
NOTE: For security reasons, installations of Grafana Agent Flow on non-containerized platforms default to listening on
localhost. This default prevents other machines on the network from being able to view the UI.To expose the UI to other machines on the network on non-containerized platforms, refer to the documentation for how you installed Grafana Agent Flow.
If you are running a custom installation of Grafana Agent Flow, refer to the documentation for [the
grafana-agent runcommand][grafana-agent run] to learn how to change the HTTP listen address, and pass the appropriate flag when running Grafana Agent Flow.
Home page
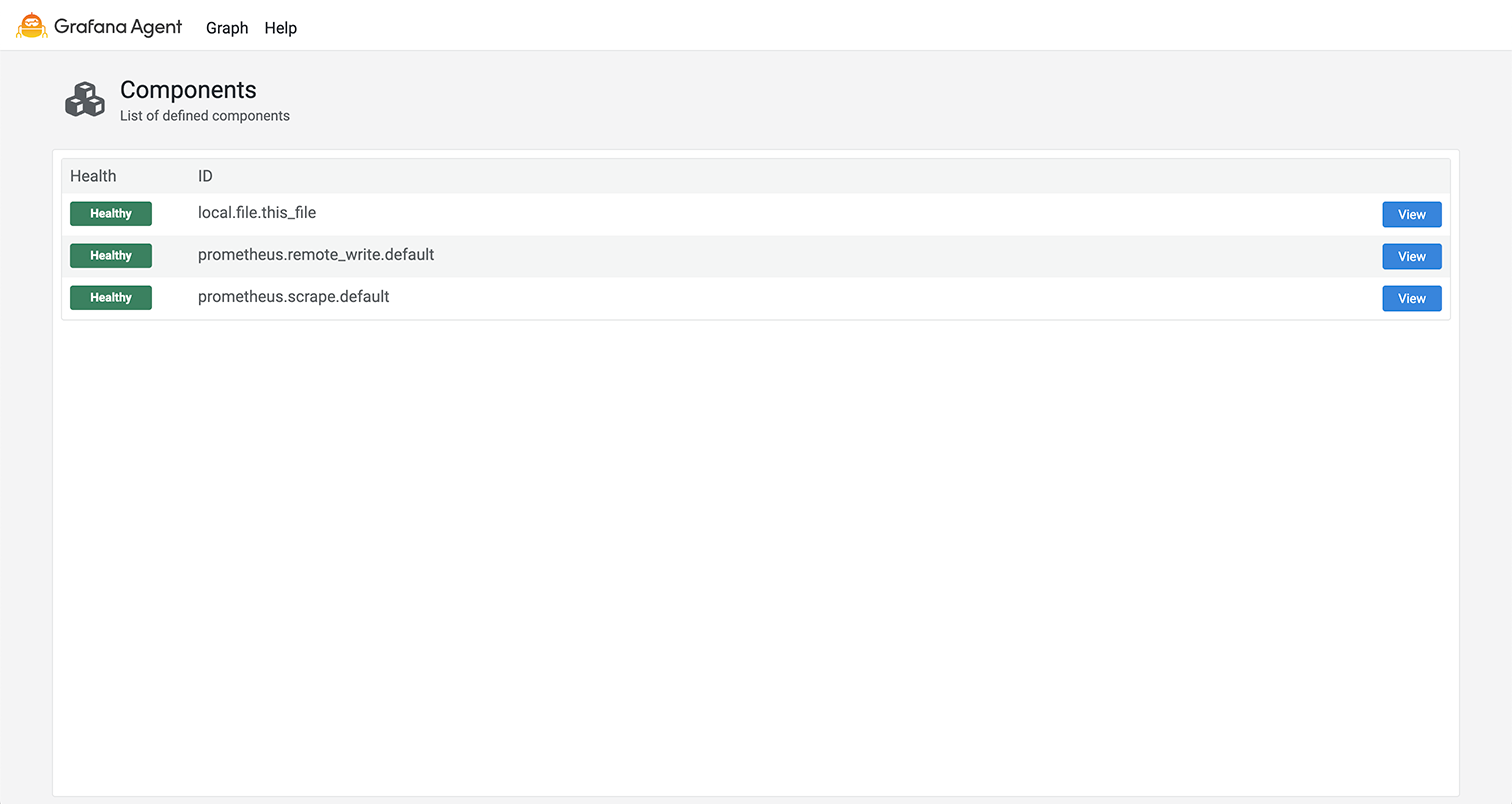
The home page shows a table of components defined in the configuration file and their health.
Click View on a row in the table to navigate to the Component detail page for that component.
Click the Grafana Agent logo to navigate back to the home page.
Graph page
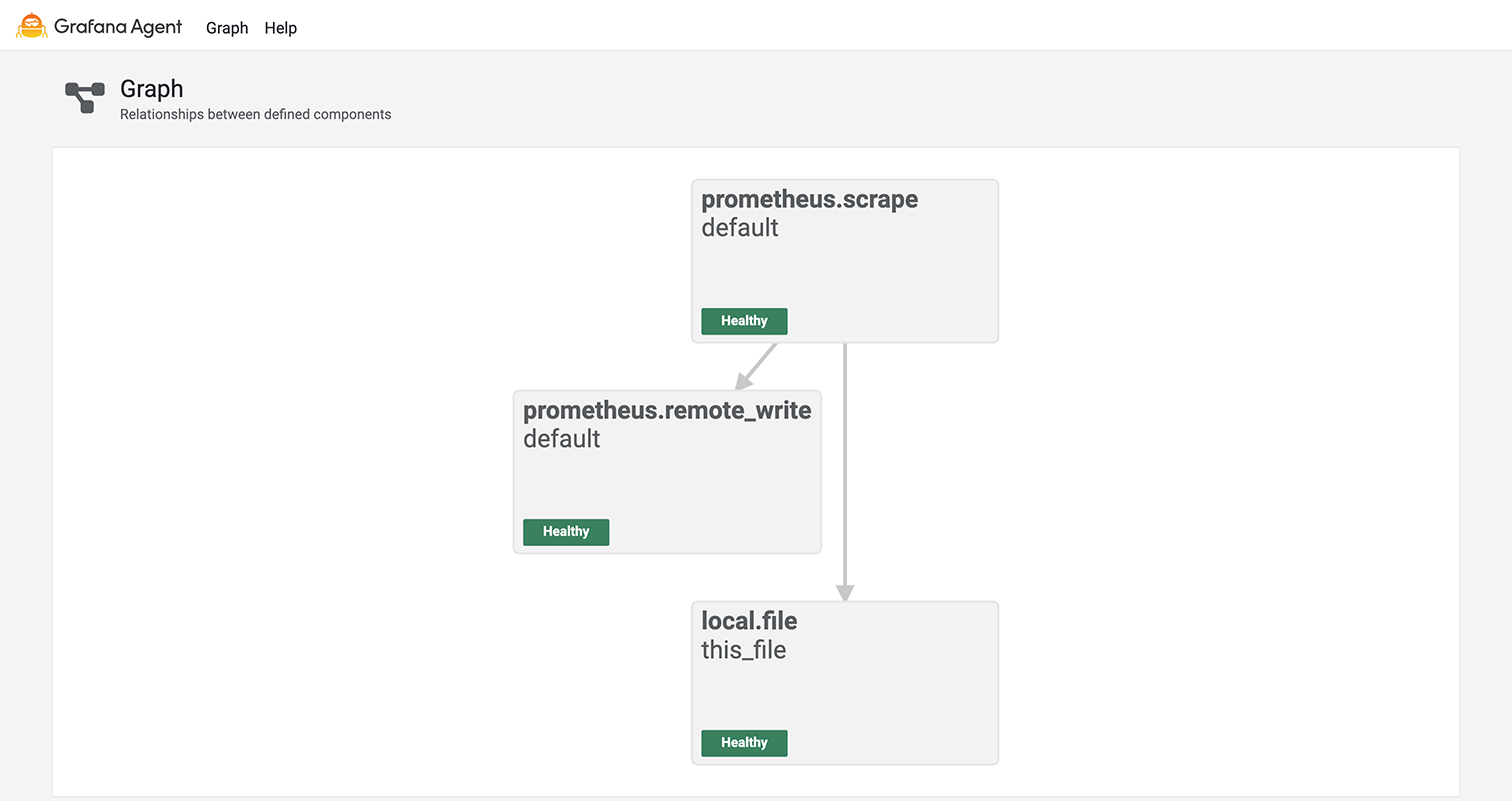
The Graph page shows a graph view of components defined in the configuration file and their health. Clicking a component in the graph navigates to the Component detail page for that component.
Component detail page
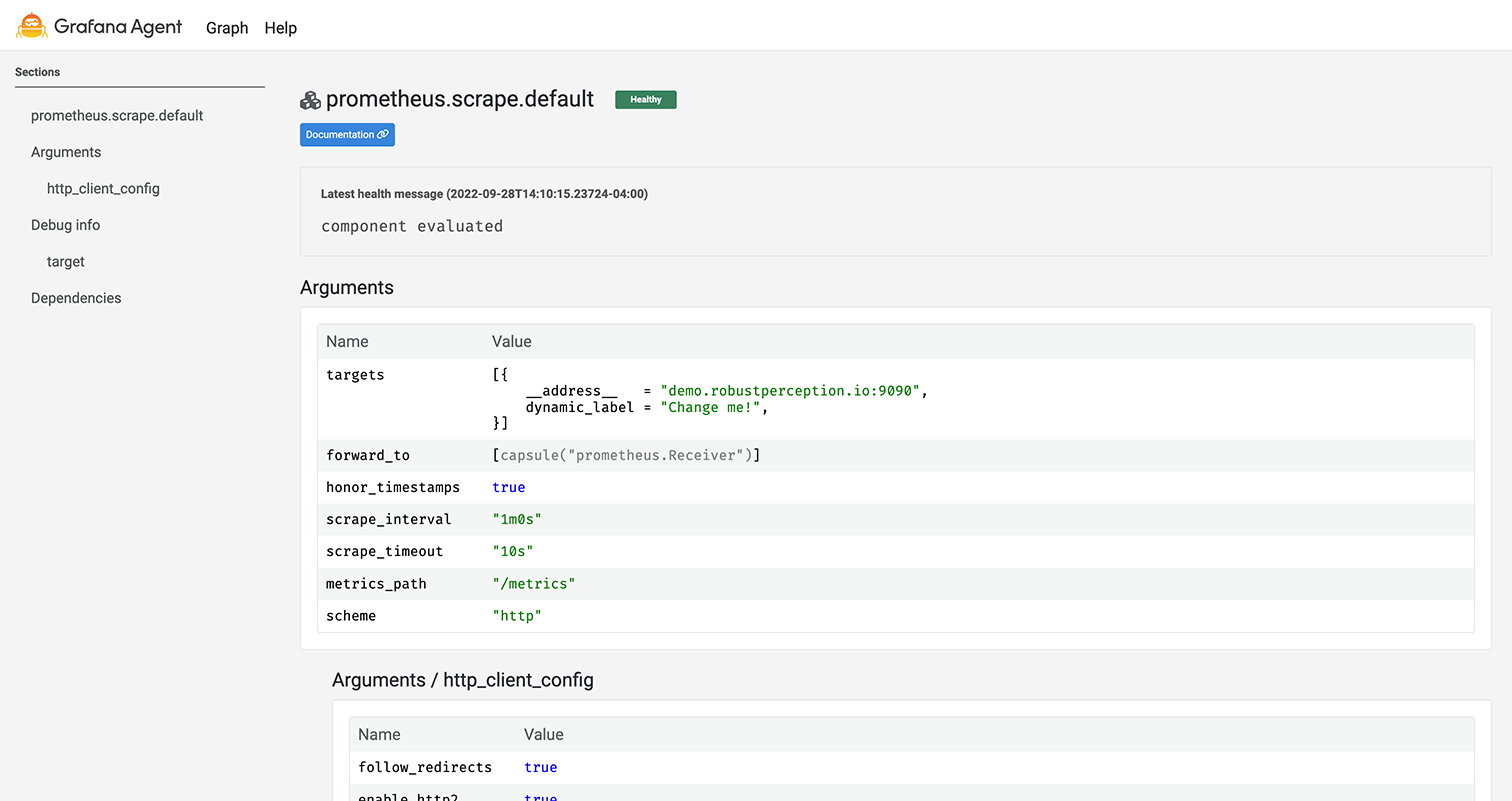
The component detail page shows the following information for each component:
- The health of the component with a message explaining the health.
- The current evaluated arguments for the component.
- The current exports for the component.
- The current debug info for the component (if the component has debug info).
Values marked as a secret are obfuscated and display as the text
(secret).
Clustering page
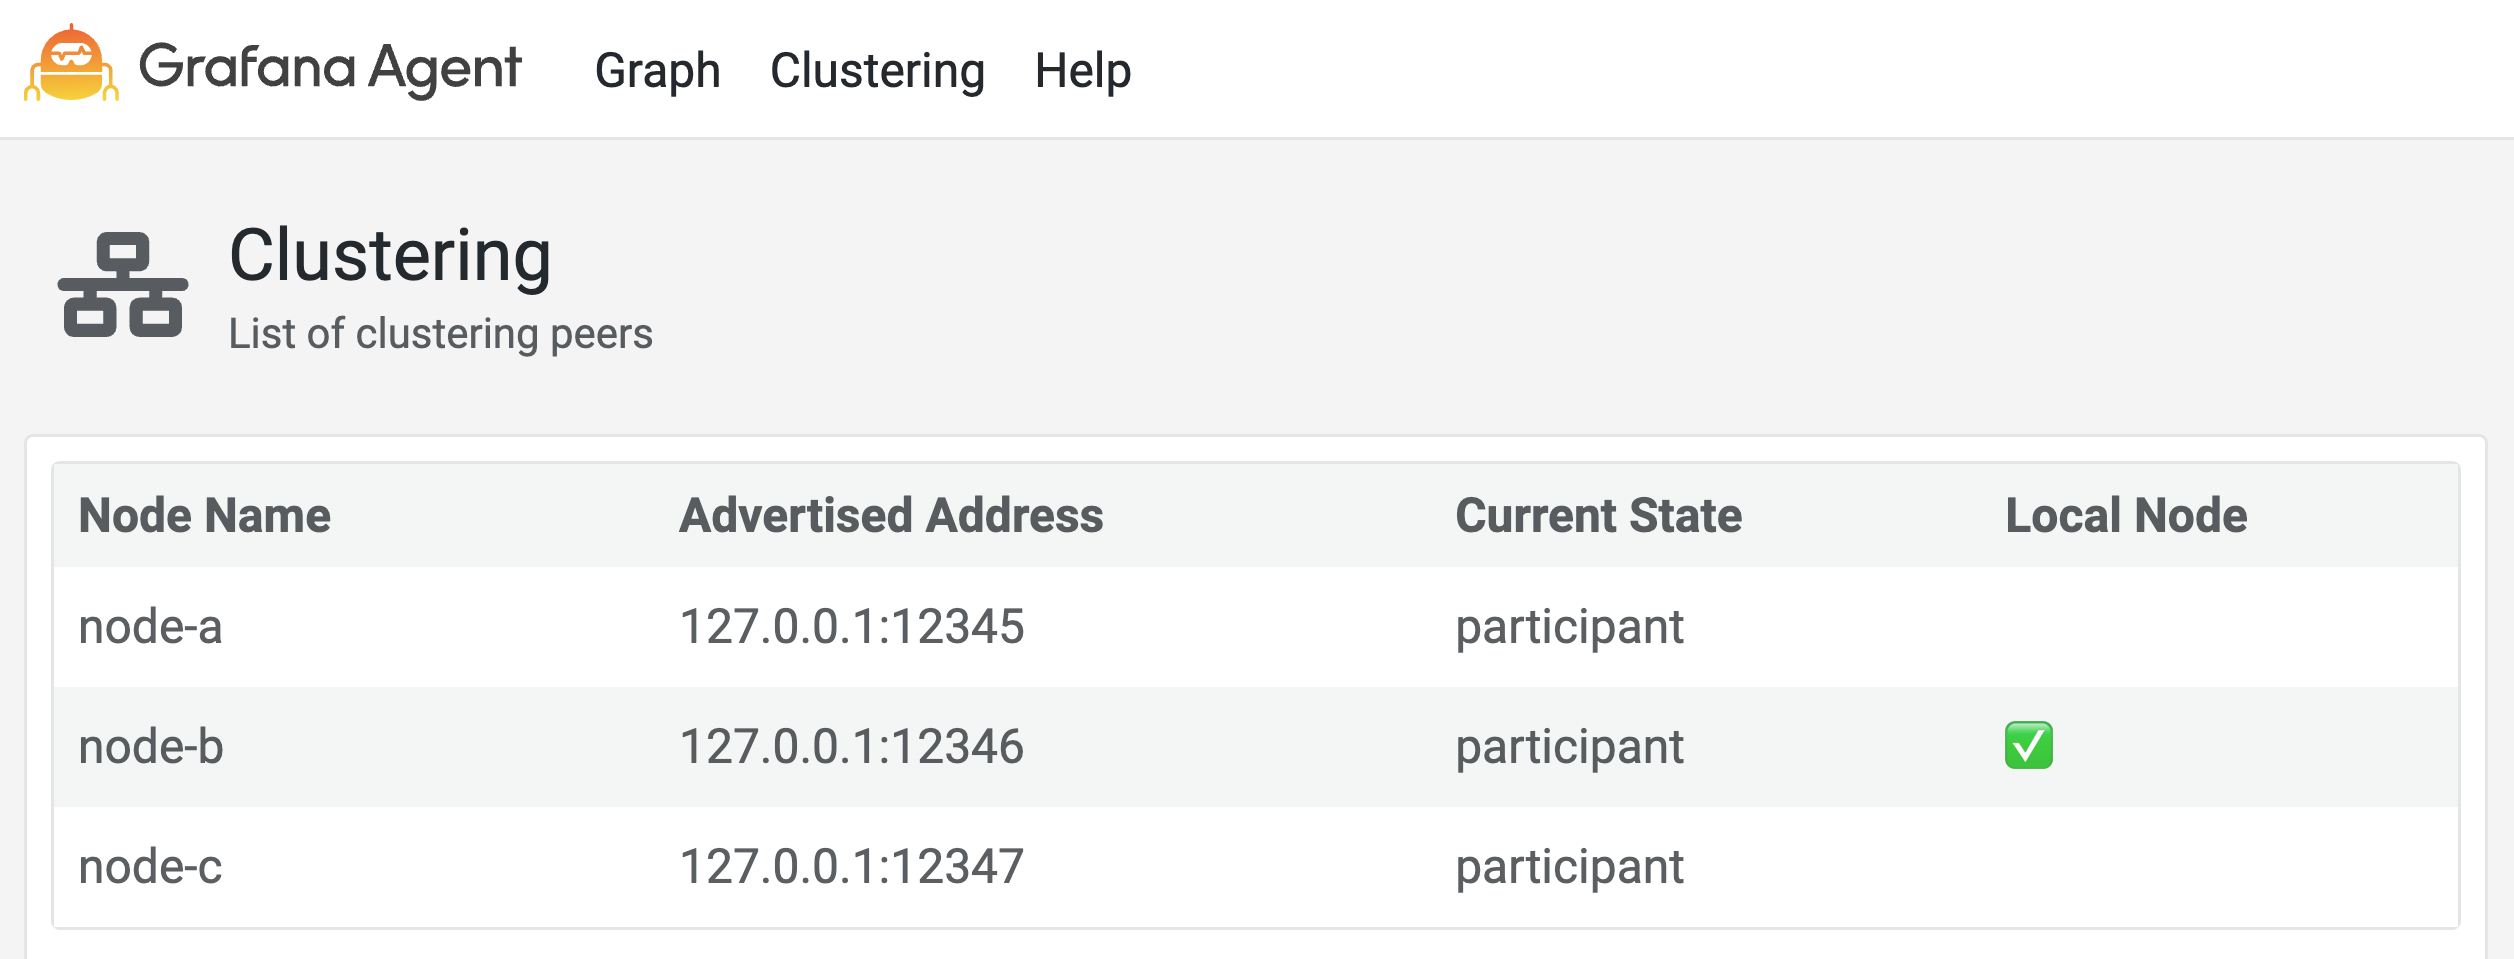
The Clustering page shows the following information for each cluster node:
- The node’s name.
- The node’s advertised address.
- The node’s current state (Viewer/Participant/Terminating).
- The local node that serves the UI.
Debugging using the UI
To debug using the UI:
- Ensure that no component is reported as unhealthy.
- Ensure that the arguments and exports for misbehaving components appear correct.
Examining logs
Logs may also help debug issues with Grafana Agent Flow.
To reduce logging noise, many components hide debugging info behind debug-level log lines.
It is recommended that you configure the
logging block to show debug-level log lines when debugging issues with Grafana Agent Flow.
The location of Grafana Agent Flow logs is different based on how it’s deployed.
Refer to the
logging block page to see how to find logs for your system.
Debugging clustering issues
To debug issues when using clustering, check for the following symptoms.
- Cluster not converging: The cluster peers aren’t converging on the same view of their peers’ status. This is most likely due to network connectivity issues between the cluster nodes. Use the Grafana Agent Flow UI of each running peer to understand which nodes aren’t being picked up correctly.
- Cluster split brain: The cluster peers aren’t aware of one another, thinking they’re the only node present. Again, check for network connectivity issues. Check that the addresses or DNS names given to the node to join are correctly formatted and reachable.
- Configuration drift: Clustering assumes that all nodes are running with the same configuration file at roughly the same time. Check the logs for issues with the reloaded configuration file as well as the graph page to verify changes have been applied.
- Node name conflicts: Clustering assumes all nodes have unique names. Nodes with conflicting names are rejected and won’t join the cluster. Look at the clustering UI page for the list of current peers with their names, and check the logs for any reported name conflict events.
- Node stuck in terminating state: The node attempted to gracefully shut down and set its state to Terminating, but it has not completely gone away. Check the clustering page to view the state of the peers and verify that the terminating Grafana Agent has been shut down.
Note
Some issues that appear to be clustering issues may be symptoms of other issues, for example, problems with scraping or service discovery can result in missing metrics for an agent that can be interpreted as a node not joining the cluster.
Was this page helpful?
Related resources from Grafana Labs


