Caution
Grafana Agent has reached End-of-Life (EOL) on November 1, 2025. Agent is no longer receiving vendor support and will no longer receive security or bug fixes. Current users of Agent Static mode, Agent Flow mode, and Agent Operator should proceed with migrating to Grafana Alloy. If you have already migrated to Alloy, no further action is required. Read more about why we recommend migrating to Grafana Alloy.
This is documentation for the next version of Grafana Agent Documentation. For the latest stable release, go to the latest version.
Processing Logs
This tutorial assumes you are familiar with setting up and connecting components.
It covers using loki.source.api to receive logs over HTTP, processing and filtering them, and sending them to Loki.
Receive logs over HTTP and Process
Recommended reading
- Optional: loki.source.api
The loki.source.api component can receive logs over HTTP.
It can be useful for receiving logs from other Grafana Agents or collectors, or directly from applications that can send logs over HTTP, and then processing them centrally.
Your pipeline is going to look like this:

Let’s start by setting up the loki.source.api component:
loki.source.api "listener" {
    http {
        listen_address = "127.0.0.1"
        listen_port    = 9999
    }

    labels = { "source": "api" }

    forward_to = [loki.process.process_logs.receiver]
}
This is a simple configuration.
You are configuring the loki.source.api component to listen on 127.0.0.1:9999 and attach a source="api" label to the received log entries, which are then forwarded to the loki.process.process_logs component’s exported receiver.
Next, you can configure the loki.process and loki.write components.
Process and Write Logs
Recommended reading
// Let's send and process more logs!

loki.source.api "listener" {
    http {
        listen_address = "127.0.0.1"
        listen_port    = 9999
    }

    labels = { "source" = "api" }

    forward_to = [loki.process.process_logs.receiver]
}

loki.process "process_logs" {

    // Stage 1
    stage.json {
        expressions = {
            log = "",
            ts  = "timestamp",
        }
    }

    // Stage 2
    stage.timestamp {
        source = "ts"
        format = "RFC3339"
    }

    // Stage 3
    stage.json {
        source = "log"

        expressions = {
            is_secret = "",
            level     = "",
            log_line  = "message",
        }
    }

    // Stage 4
    stage.drop {
        source = "is_secret"
        value  = "true"
    }

    // Stage 5
    stage.labels {
        values = {
            level = "",
        }
    }

    // Stage 6
    stage.output {
        source = "log_line"
    }

    // This stage adds static values to the labels on the log line
    stage.static_labels {
        values = {
            source = "demo-api",
        }
    }

    forward_to = [loki.write.local_loki.receiver]
}

loki.write "local_loki" {
    endpoint {
        url = "http://localhost:3100/loki/api/v1/push"
    }
}
You can skip to the next section if you successfully completed the previous section’s exercises.
If not, or if you were unsure how things worked, let’s break down what is happening in the loki.process component.
Many of the stage.* blocks in loki.process act on reading or writing a shared map of values extracted from the logs.
You can think of this extracted map as a hashmap or table that each stage has access to, and it is referred to as the “extracted map” from here on.
In subsequent stages, you can use the extracted map to filter logs, add or remove labels, or even modify the log line.
Note
stage.*blocks are executed in the order they appear in the component, top down.
Let’s use an example log line to illustrate this, then go stage by stage, showing the contents of the extracted map. Here is our example log line:
{
    "log": {
        "is_secret": "true",
        "level": "info",
        "message": "This is a secret message!",
    },
    "timestamp": "2023-11-16T06:01:50Z",
}
Stage 1
stage.json {
    expressions = {
        log = "",
        ts  = "timestamp",
    }
}
This stage parses the log line as JSON, extracts two values from it, log and timestamp, and puts them into the extracted map with keys log and ts, respectively.
Note
Supplying an empty string is shorthand for using the same key as in the input log line (so
log = ""is the same aslog = "log"). The keys of theexpressionsobject end up as the keys in the extracted map, and the values are used as keys to look up in the parsed log line.
If this were Python, it would be roughly equivalent to:
extracted_map = {}
log_line      = {"log": {"is_secret": "true", "level": "info", "message": "This is a secret message!"}, "timestamp": "2023-11-16T06:01:50Z"}

extracted_map["log"] = log_line["log"]
extracted_map["ts"]  = log_line["timestamp"]
Extracted map before performing this stage:
{}Extracted map after performing this stage:
{
    "log": {
        "is_secret": "true",
        "level": "info",
        "message": "This is a secret message!",
    },
    "ts": "2023-11-16T06:01:50Z",
}
Stage 2
stage.timestamp {
    source = "ts"
    format = "RFC3339"
}
This stage acts on the ts value in the map you extracted in the previous stage.
The value of ts is parsed in the format of RFC3339 and added as the timestamp to be ingested by Loki.
This is useful if you want to use the timestamp present in the log itself, rather than the time the log is ingested.
This stage does not modify the extracted map.
Stage 3
stage.json {
    source = "log"

    expressions = {
        is_secret = "",
        level     = "",
        log_line  = "message",
    }
}
This stage acts on the log value in the extracted map, which is a value that you extracted in the previous stage.
This value is also a JSON object, so you can extract values from it as well.
This stage extracts three values from the log value, is_secret, level, and log_line, and puts them into the extracted map with keys is_secret, level, and log_line.
If this were Python, it would be roughly equivalent to:
extracted_map = {
    "log": {
        "is_secret": "true",
        "level": "info",
        "message": "This is a secret message!",
    },
    "ts": "2023-11-16T06:01:50Z",
}

source = extracted_map["log"]

extracted_map["is_secret"] = source["is_secret"]
extracted_map["level"]     = source["level"]
extracted_map["log_line"]  = source["message"]
Extracted map before performing this stage:
{
    "log": {
        "is_secret": "true",
        "level": "info",
        "message": "This is a secret message!",
    },
    "ts": "2023-11-16T06:01:50Z",
}
Extracted map after performing this stage:
{
    "log": {
        "is_secret": "true",
        "level": "info",
        "message": "This is a secret message!",
    },
    "ts": "2023-11-16T06:01:50Z",
    "is_secret": "true",
    "level": "info",
    "log_line": "This is a secret message!",
}
Stage 4
stage.drop {
    source = "is_secret"
    value  = "true"
}
This stage acts on the is_secret value in the extracted map, which is a value that you extracted in the previous stage.
This stage drops the log line if the value of is_secret is "true" and does not modify the extracted map.
There are many other ways to filter logs, but this is a simple example.
Refer to the
loki.process#stage.drop documentation for more information.
Stage 5
stage.labels {
    values = {
        level = "",
    }
}
This stage adds a label to the log using the same shorthand as above (so this is equivalent to using values = { level = "level" }).
This stage adds a label with key level and the value of level in the extracted map to the log ("info" from our example log line).
This stage does not modify the extracted map.
Stage 6
stage.output {
    source = "log_line"
}
This stage uses the log_line value in the extracted map to set the actual log line that is forwarded to Loki.
Rather than sending the entire JSON blob to Loki, you are only sending original_log_line["log"]["message"], along with some labels that you attached.
This stage does not modify the extracted map.
Putting it all together
Now that you have all of the pieces, let’s run the Grafana Agent and send some logs to it.
Modify config.river with the config from the previous example and start the Grafana Agent with:
/path/to/agent run config.riverTo get the current time in RFC3339 format, you can run:
date -u +"%Y-%m-%dT%H:%M:%SZ"Try executing the following, replacing the "timestamp" value:
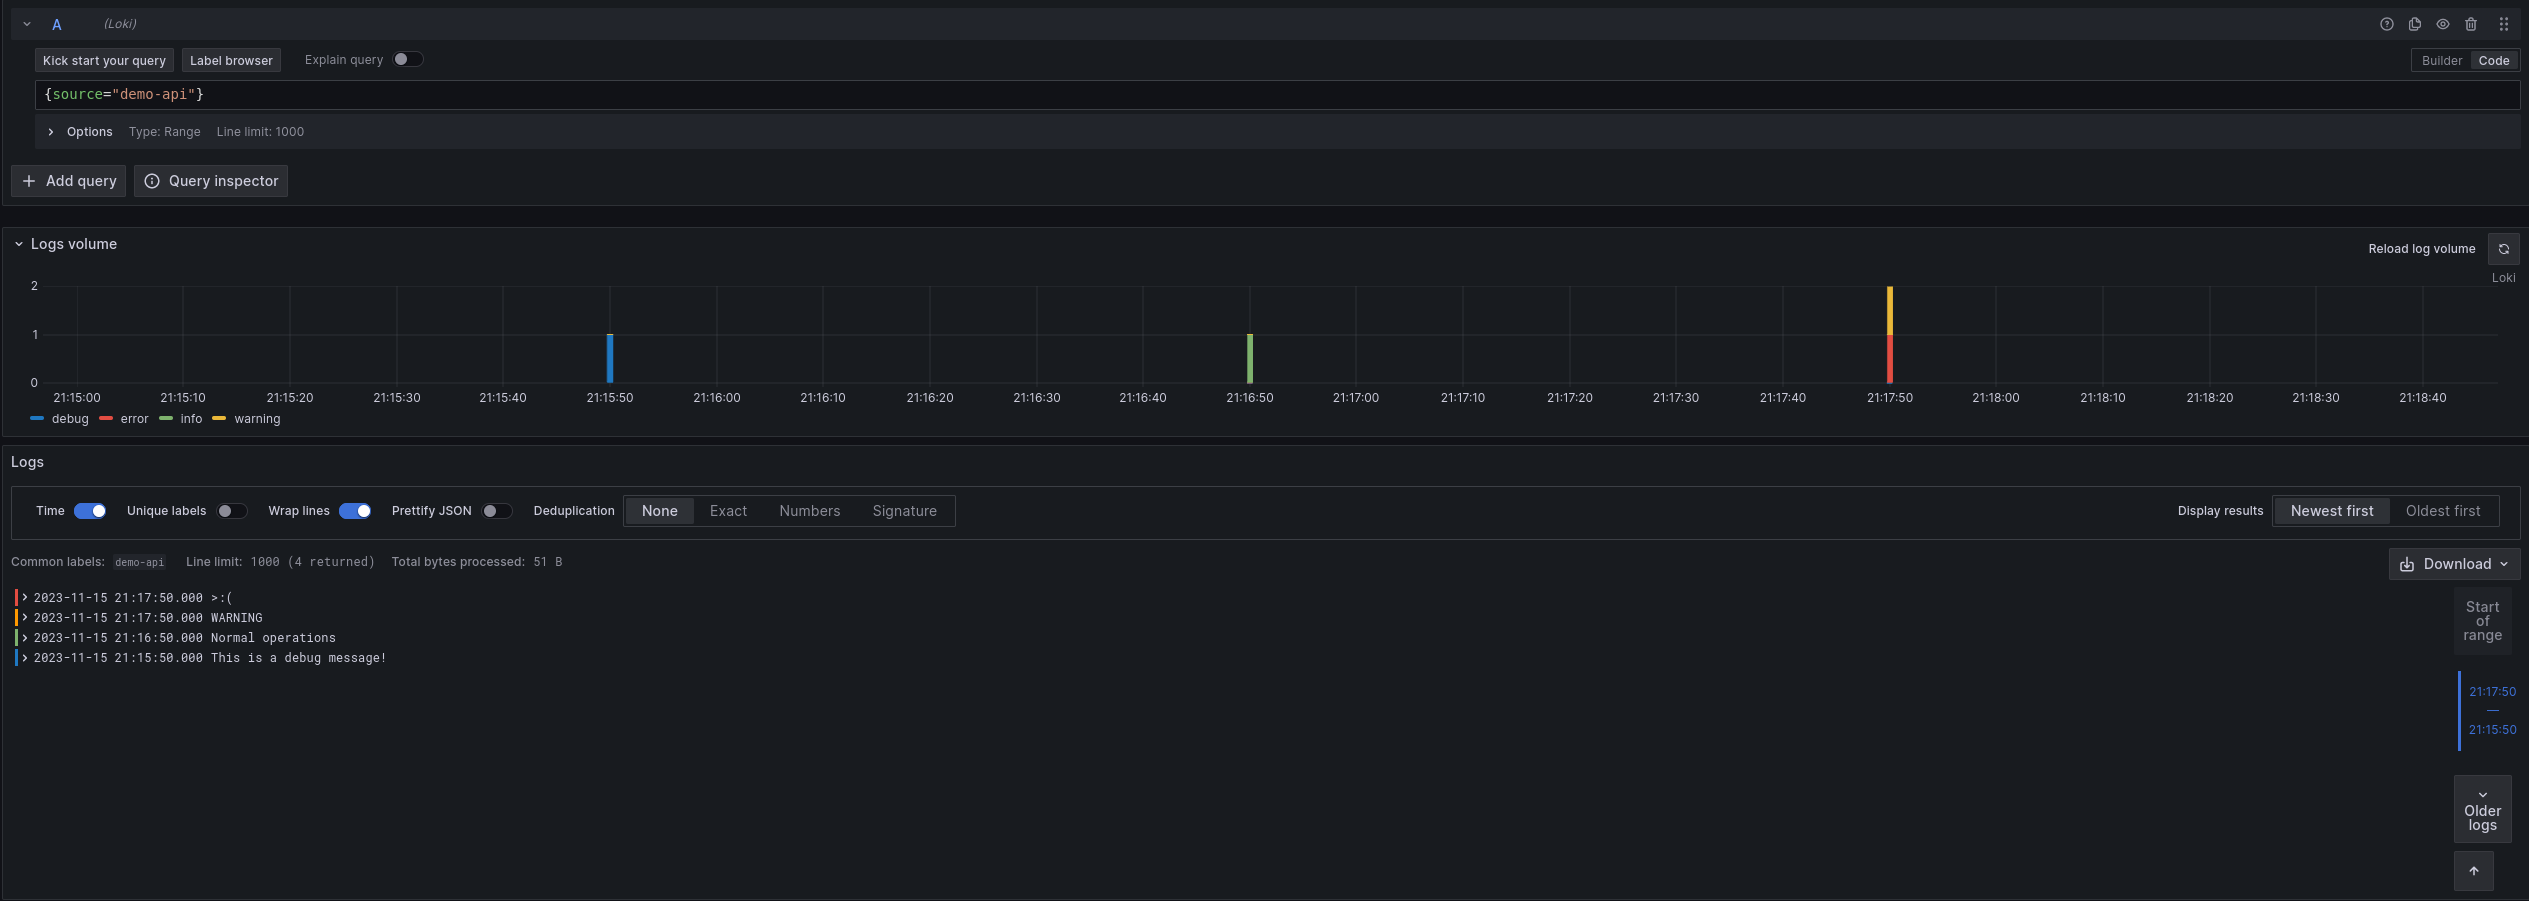
curl localhost:9999/loki/api/v1/raw -XPOST -H "Content-Type: application/json" -d '{"log": {"is_secret": "false", "level": "debug", "message": "This is a debug message!"}, "timestamp": <YOUR TIMESTAMP HERE>}'Now that you have sent some logs, let’s see how they look in Grafana.
Navigate to localhost:3000/explore and switch the Datasource to Loki.
Try querying for {source="demo-api"} and see if you can find the logs you sent.
Try playing around with the values of "level", "message", "timestamp", and "is_secret" and see how the logs change.
You can also try adding more stages to the loki.process component to extract more values from the logs, or add more labels.
Exercise
Since you are already using Docker and Docker exports logs, let’s get those logs into Loki. You can refer to the discovery.docker and loki.source.docker documentation for more information.
To ensure proper timestamps and other labels, make sure you use a loki.process component to process the logs before sending them to Loki.
Although you have not used it before, let’s use a discovery.relabel component to attach the container name as a label to the logs.
You can refer to the
discovery.relabel documentation for more information.
The discovery.relabel component is very similar to the prometheus.relabel component, but is used to relabel discovered targets rather than metrics.
// Discover docker containers to collect logs from
discovery.docker "docker_containers" {
    // Note that if you are using Docker Desktop Engine this may need to be changed to
    // something like "unix:///${HOME}/.docker/desktop/docker.sock"
    host = "unix:///var/run/docker.sock"
}

// Extract container name from __meta_docker_container_name label and add as label
discovery.relabel "docker_containers" {
    targets = discovery.docker.docker_containers.targets

    rule {
        source_labels = ["__meta_docker_container_name"]
        target_label  = "container"
    }
}

// Scrape logs from docker containers and send to be processed
loki.source.docker "docker_logs" {
    host    = "unix:///var/run/docker.sock"
    targets = discovery.relabel.docker_containers.output
    forward_to = [loki.process.process_logs.receiver]
}

// Process logs and send to Loki
loki.process "process_logs" {
    stage.docker { }

    forward_to = [loki.write.local_loki.receiver]
}

loki.write "local_loki" {
    endpoint {
        url = "http://localhost:3100/loki/api/v1/push"
    }
}

