Caution
Grafana Alloy is the new name for our distribution of the OTel collector. Grafana Agent has been deprecated and is in Long-Term Support (LTS) through October 31, 2025. Grafana Agent will reach an End-of-Life (EOL) on November 1, 2025. Read more about why we recommend migrating to Grafana Alloy.
This is documentation for the next version of Grafana Agent Documentation. For the latest stable release, go to the latest version.
prometheus.exporter.gcp
The prometheus.exporter.gcp component embeds stackdriver_exporter.
It lets you collect GCP Cloud Monitoring (formerly stackdriver), translate them to prometheus-compatible format and remote write.
The component supports all metrics available via GCP’s monitoring API.
Metric names follow the template stackdriver_<monitored_resource>_<metric_type_prefix>_<metric_type>.
The following example shows a load balancing metric:
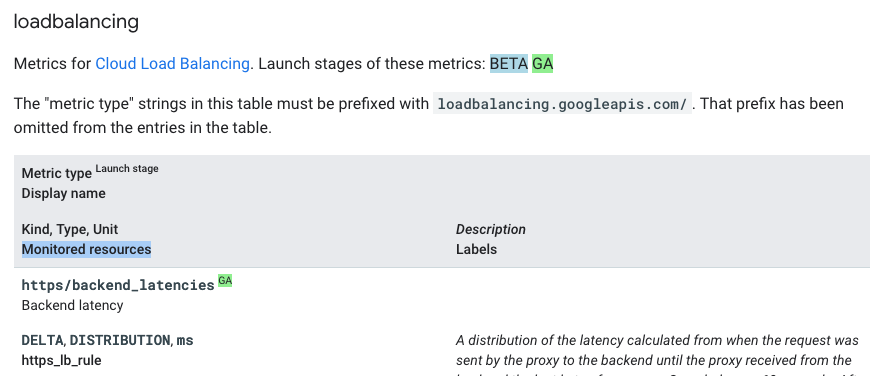
The following list shows its attributes:
monitored_resource = https_lb_rule
metric_type_prefix = loadbalancing.googleapis.com/
metric_type = https/backend_latencies
These attributes result in a final metric name of:
stackdriver_https_lb_rule_loadbalancing_googleapis_com_https_backend_latencies
Authentication
Grafana Agent must be running in an environment with access to the GCP project it is scraping. The exporter uses the Google Golang Client Library, which offers a variety of ways to provide credentials. Choose the option that works best for you.
After deciding how Grafana Agent will obtain credentials, ensure the account is set up with the IAM role roles/monitoring.viewer.
Since the exporter gathers all of its data from GCP monitoring APIs, this is the only permission needed.
Usage
prometheus.exporter.gcp "pubsub" {
        project_ids = [
                "foo",
                "bar",
        ]

        metrics_prefixes = [
                "pubsub.googleapis.com/snapshot",
                "pubsub.googleapis.com/subscription/num_undelivered_messages",
                "pubsub.googleapis.com/subscription/oldest_unacked_message_age",
        ]
}
Arguments
You can use the following arguments to configure the exporter’s behavior. Omitted fields take their default values.
Note
Please note that if you are supplying a list of strings for the
extra_filtersargument, any string values within a particular filter string must be enclosed in escaped double quotes. For example,loadbalancing.googleapis.com:resource.labels.backend_target_name="sample-value"must be encoded as"loadbalancing.googleapis.com:resource.labels.backend_target_name=\"sample-value\""in the River config.
For extra_filters, the targeted_metric_prefix is used to ensure the filter is only applied to the metric_prefix(es) where it makes sense. It does not explicitly have to match a value from metric_prefixes, but the targeted_metric_prefix must be at least a prefix to one or more metric_prefixes. The filter_query is applied to a final metrics API query when querying for metric data. The final query sent to the metrics API already includes filters for project and metric type. Each applicable filter_query is appended to the query with an AND. You can read more about the metric API filter options in GCPs documentation.
For request_interval, most of the time the default works perfectly fine. Most documented metrics include a comments of the form Sampled every X seconds. After sampling, data is not visible for up to Y seconds. As long as your request_interval is >= Y you should have no issues. Consider using ingest_delay if you would like this to be done programmatically or are gathering slower moving metrics.
For ingest_delay, you can see the values for this in documented metrics as After sampling, data is not visible for up to Y seconds. Since GCPs ingestion delay is an “at worst”, this is off by default to ensure data is gathered as soon as it’s available.
Exported fields
The following fields are exported and can be referenced by other components.
For example, the targets can either be passed to a discovery.relabel component to rewrite the targets’ label sets or to a prometheus.scrape component that collects the exposed metrics.
The exported targets use the configured in-memory traffic address specified by the run command.
Component health
prometheus.exporter.gcp is only reported as unhealthy if given
an invalid configuration. In those cases, exported fields retain their last healthy values.
Debug information
prometheus.exporter.gcp does not expose any component-specific
debug information.
Debug metrics
prometheus.exporter.gcp does not expose any component-specific
debug metrics.
Examples
prometheus.exporter.gcp "lb_with_filter" {
        project_ids = [
                "foo",
                "bar",
        ]
        metrics_prefixes = [
                "loadbalancing.googleapis.com",
        ]
        extra_filters = [
                "loadbalancing.googleapis.com:resource.labels.backend_target_name=\"sample-value\"",
        ]
}prometheus.exporter.gcp "lb_subset_with_filter" {
project_ids = [
"foo",
"bar",
]
metrics_prefixes = [
"loadbalancing.googleapis.com/https/request_bytes_count",
"loadbalancing.googleapis.com/https/total_latencies",
]
extra_filters = [
"loadbalancing.googleapis.com:resource.labels.backend_target_name=\"sample-value\"",
]
}Compatible components
prometheus.exporter.gcp has exports that can be consumed by the following components:
- Components that consume Targets
Note
Connecting some components may not be sensible or components may require further configuration to make the connection work correctly. Refer to the linked documentation for more details.
Was this page helpful?
Related resources from Grafana Labs