
This is documentation for the next version of Grafana Loki documentation. For the latest stable release, go to the latest version.
Query Loki
When you want to look for certain logs stored in Loki, you specify a set of labels that identify them. When Loki receives log entries, it groups them into log streams. When Loki stores log streams they are compressed and stored in chunks and Loki then creates an index for the chunks that acts as a table of contents. When you write a query, Loki searches the index to determine which chunks to retrieve from storage for display.
There are several ways to query Loki, but all of them use LogQL, Loki’s query language, under the hood.
Loki does not have a user interface, so most users install Grafana in order to visualize their log data. From Grafana, you can use:
- Grafana Logs Drilldown to automatically visualize your log data. Logs Drilldown uses default queries to provide a set of initial visualizations that display information we think you’ll find relevant to get you started viewing your logs without having to write queries.
- Grafana Explore helps you examine your data ad-hoc or build and refine a LogQL query for inclusion within a dashboard.
You can also run queries against Loki using LogCLI, the command-line interface to Grafana Loki.
LogQL
LogQL is the query language for Grafana Loki. Since Loki doesn’t require a strict schema or structure for log information up front, LogQL allows you to create a “schema at query”. This means that a schema for a log line is inferred when you write a query, rather than when a log line is ingested.
LogQL is based on PromQL, but you don’t need to know PromQL to write LogQL.
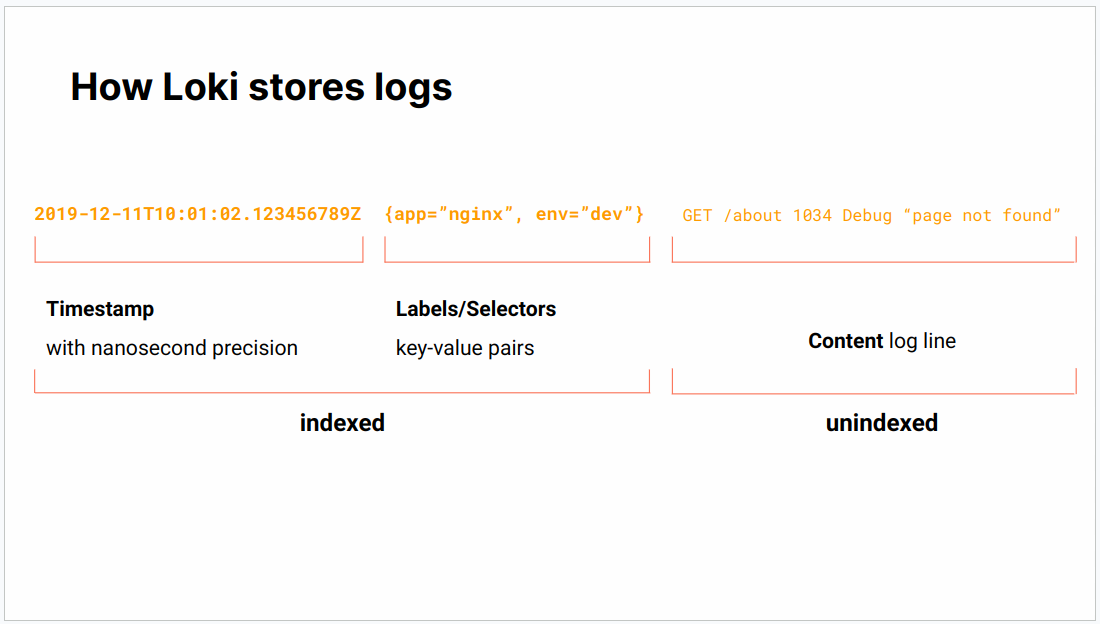
A Loki log consists of:
- a timestamp
- labels/selectors
- content of the log line.
Loki indexes the timestamp and labels, but not the rest of the log line.
LogQL queries are in the following format:
{ log stream selector } | log pipelineThe log stream selector is mandatory while the log pipeline is optional.
Log stream selector
The log stream selector, also called label selector, is a string containing key-value pairs like this:
{service_name="nginx", status="500"}The unique combination of all these pairs is called a stream. The goal of the log stream selector is to narrow down the data set to be processed and filtered in the log pipeline by using either predetermined (in the Loki config) or automatically detected labels.
Tip
service_nameis a default label that Loki creates and tries to populate with something in the log line that looks like a service name. The service name label is used to find and explore logs in Logs Drilldown. However, the default can be changed in Loki configuration.
The following operators can be used in the log stream selector:
=labels that are exactly equal to the log stream selector!=labels that are not equal to the log stream selector=~labels that are a regex-match to the log stream selector!~labels that are not a regex-match to the log stream selector
where the ~ character is used for regular expressions.
Log pipeline
The optional log pipline may contain any combination of the following expressions:
- filters
- parsers
- formatters
Filter expressions
Filter expressions are used to look for a certain string or range of values within the log line or label.
For label filters, the following operators can be used:
==or=for equality.!=for inequality.>and>=for greater than and greater than or equal.<and<=for lesser than and lesser than or equal.
and and or can also be used to chain operations for label filters.
For line filters, the following operators can be used:
|=: Log line contains string!=: Log line does not contain string|~: Log line contains a match to the regular expression!~: Log line does not contain a match to the regular expression
Parser expressions
Parser expressions are used to filter logs that are in a standardized format, such as:
In this example, the json parser is used to get the parameters request_method and request_uri and use them to filter log lines:
{$label_name=~"$label_value", job=~"$job", instance=~"$instance"} | json | line_format "➡️ {{.request_method}} {{.request_uri}} with HTTP status: {{.status}} "Format expressions
Format expressions can be used to change the way lines (line_format()) and labels (label_format()) are displayed. Note that format expressions do not change the underlying source data, only the results that are returned by the query.
The previous example uses a line_format() function to rewrite the original log line:
{"msec": "1733828027.704", "connection": "81290341", "connection_requests": "1", "pid": "24", "request_id": "7a98025445386b1feef1402bb13362e5", "request_length": "559", "remote_addr": "52.167.144.255", "remote_user": "", "remote_port": "", "time_local": "10/Dec/2024:10:53:47 +0000", "time_iso8601": "2024-12-10T10:53:47+00:00", "request": "GET /a/1080936380/alternative-to-refaid-refugee-aid-app.html HTTP/1.1", "request_uri": "/a/1080936380/alternative-to-refaid-refugee-aid-app.html", "args": "", "status": "200", "body_bytes_sent": "11497", "bytes_sent": "11676", "http_referer": "", "http_user_agent": "Mozilla/5.0 AppleWebKit/537.36 (KHTML, like Gecko; compatible; bingbot/2.0; +http://www.bing.com/bingbot.htm) Chrome/116.0.1938.76 Safari/537.36", "http_x_forwarded_for": "52.167.144.255", "http_host": "nl.appfelstrudel.com", "server_name": "ns565366.ip-54-39-133.net", "request_time": "0.105", "upstream": "172.19.0.255:3006", "upstream_connect_time": "0.000", "upstream_header_time": "0.100", "upstream_response_time": "0.100", "upstream_response_length": "72787", "upstream_cache_status": "MISS", "ssl_protocol": "", "ssl_cipher": "", "scheme": "http", "request_method": "GET", "server_protocol": "HTTP/1.1", "pipe": ".", "gzip_ratio": "6.34", "http_cf_ray": "8efcb173cc760648-IAD","geoip_country_code": "US"}to this much more readable line in the results:
➡️ GET /a/1413644634/alternative-to-balaji-quotes-hindi.html with HTTP status: 200 Types of LogQL queries
There are two types of LogQL queries:
- Log queries return the contents of log lines.
- Metric queries let you create metrics from logs.
Log queries are queries whose output remains strings, structured or otherwise. They use the log stream selector and log pipeline construction and can be chained together to create longer log queries.
Metric queries calculate values based on the log results returned.


