Important: This documentation is about an older version. It's relevant only to the release noted, many of the features and functions have been updated or replaced. Please view the current version.
Time Range Controls
Grafana provides numerous ways to manage the time ranges of the data being visualized, both at the Dashboard-level and the Panel-level.
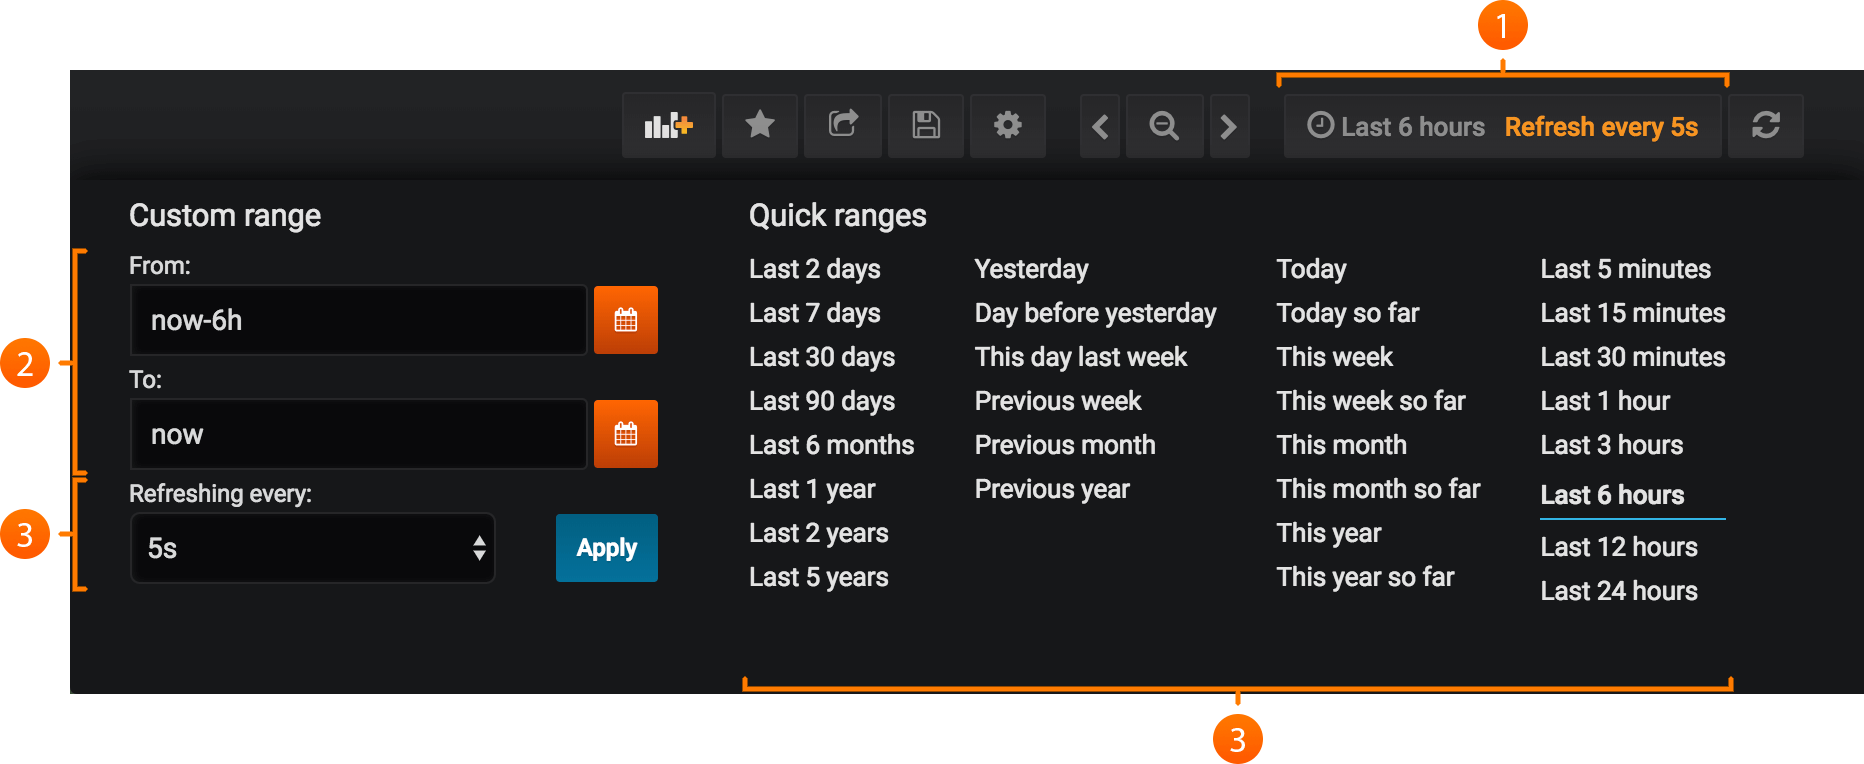
The two controls for time visualization are available in the top right:
- Current time range: This shows the current dashboard time. You can click on it to change it.
- Refresh interval: This shows the current refresh interval for the current dashboard. You can click on it to change it. This feature is especially useful for always-on displays so that the most recent data is always shown.
These settings apply to all Panels in the Dashboard (except those with Panel Time Overrides enabled)
Time Units
The following time units are supported: s (seconds), m (minutes), h (hours), d (days), w (weeks), M (months), y (years). The minus operator allows you to step back in time, relative to now. If you wish to display the full period of the unit (day, week, month, etc…), append /$unit to the end.
Take a look at some examples to seen these concepts in practice:
Dashboard Time Options
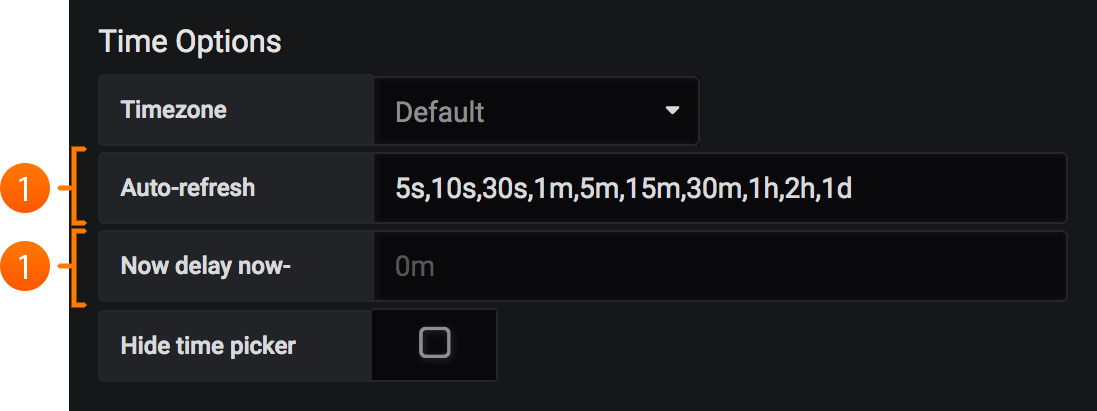
There are two settings available in the Dashboard Settings General tab, allowing customization of the auto-refresh intervals and the definition of now.
Auto-Refresh Options
It’s possible to customize the options displayed for relative time and the auto-refresh options.
From Dashboard settings, click the Timepicker tab. From here you can specify the relative and auto-refresh intervals. The Timepicker tab settings are saved on a per Dashboard basis. Entries are comma separated and accept any valid time unit.
Defining Now
Grafana offers the ability to override the now value on a per dashboard basis. Most commonly, this feature is used to accommodate known delays in data aggregation to avoid null values.
Panel time overrides and timeshift
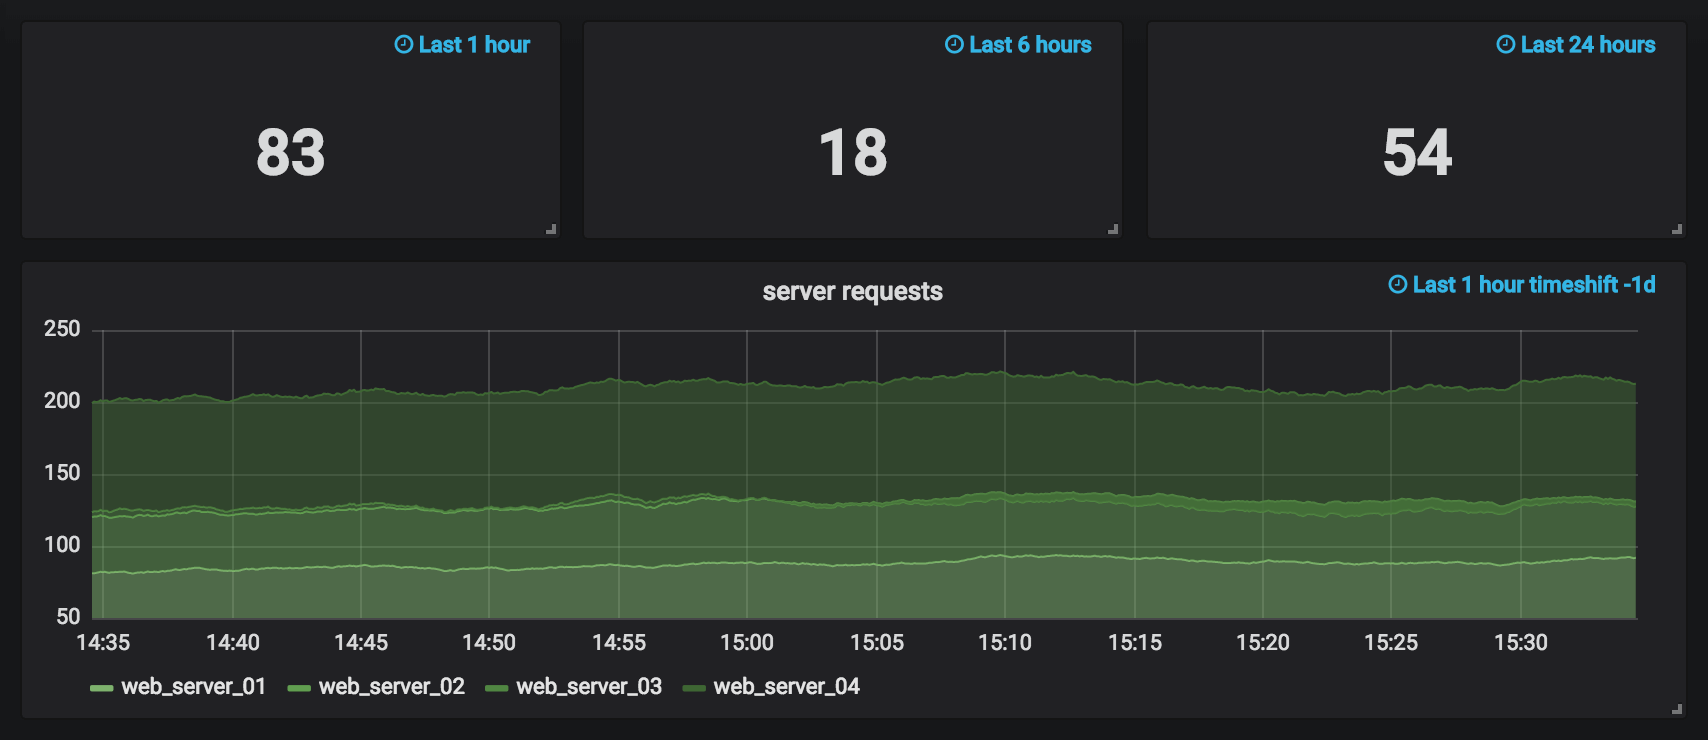
You can override the relative time range for individual panels, causing them to be different than what is selected in the Dashboard time picker in the upper right. This allows you to show metrics from different time periods or days at the same time.
You control these overrides in panel editor mode and the tab Time Range.
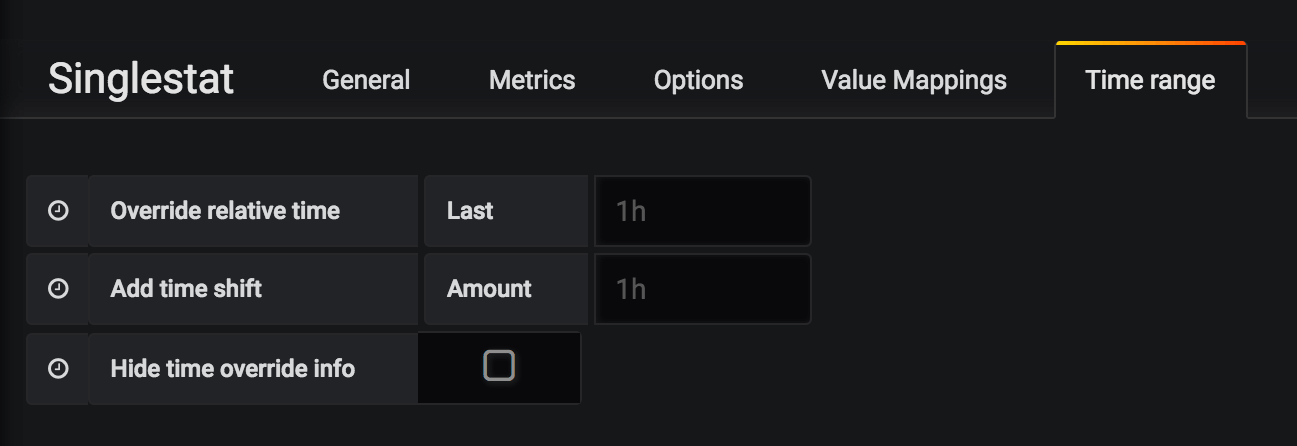
When you zoom or change the Dashboard time to a custom absolute time range, all panel overrides will be disabled. The panel relative time override is only active when the dashboard time is also relative. The panel timeshift override is always active, even when the dashboard time is absolute.
The Hide time override info option allows you to hide the override info text that is by default shown in the
upper right of a panel when overridden time range options.
Note: You can only override the dashboard time with relative time ranges. Absolute time ranges are not available.
Controlling time range using URL
Time range of a dashboard can be controlled by providing following query parameters in dashboard URL:
from- defines lower limit of the time range, specified in ms epochto- defines upper limit of the time range, specified in ms epochtimeandtime.window- defines a time range fromtime-time.window/2totime+time.window/2. Both params should be specified in ms. For example?time=1500000000000&time.window=10000will result in 10s time range from 1499999995000 to 1500000005000


