Important: This documentation is about an older version. It's relevant only to the release noted, many of the features and functions have been updated or replaced. Please view the current version.
Getting started
This guide will help you get started and acquainted with Grafana. It assumes you have a working Grafana server up and running. If not please read the installation guide.
Logging in for the first time
To run Grafana open your browser and go to http://localhost:3000/. 3000 is the default HTTP port that Grafana listens to if you haven’t configured a different port.
There you will see the login page. Default username is admin and default password is admin. When you log in for the first time you will be asked to change your password. We strongly encourage you to follow Grafana’s best practices and change the default administrator password. You can later go to user preferences and change your user name.
How to add a data source

Before you create your first dashboard you need to add your data source.
First move your cursor to the cog on the side menu which will show you the configuration menu. If the side menu is not visible click the Grafana icon in the upper left corner. The first item on the configuration menu is data sources, click on that and you’ll be taken to the data sources page where you can add and edit data sources. You can also simply click the cog.
Click Add data source and you will come to the settings page of your new data source.

First, give the data source a Name and then select which Type of data source you’ll want to create, see Supported data sources for more information and how to configure your data source.

After you have configured your data source you are ready to save and test.
Beginner guides
Watch the 10min beginners guide to building dashboards to get a quick intro to setting up Dashboards and Panels.
Basic concepts
Read the Basic Concepts document to get a crash course in key Grafana concepts.
Top header
Let’s start with creating a new Dashboard. You can find the new Dashboard link on the right side of the Dashboard picker. You now have a blank Dashboard.
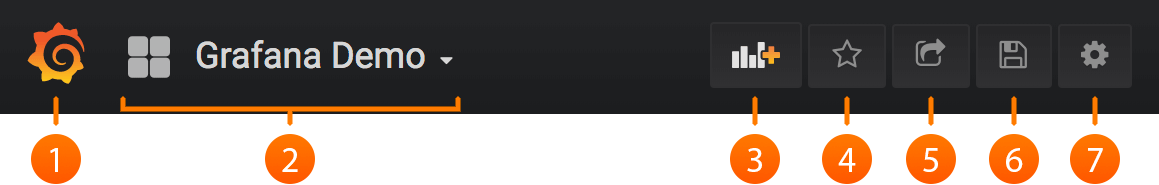
The image above shows you the top header for a Dashboard.
- Side menubar toggle: This toggles the side menu, allowing you to focus on the data presented in the dashboard. The side menu provides access to features unrelated to a Dashboard such as Users, Organizations, and Data Sources.
- Dashboard dropdown: This dropdown shows you which Dashboard you are currently viewing, and allows you to easily switch to a new Dashboard. From here you can also create a new Dashboard or folder, Import existing Dashboards, and manage Dashboard playlists.
- Add Panel: Adds a new panel to the current Dashboard
- Star Dashboard: Star (or unstar) the current Dashboard. Starred Dashboards will show up on your own Home Dashboard by default, and are a convenient way to mark Dashboards that you’re interested in.
- Share Dashboard: Share the current dashboard by creating a link or create a static Snapshot of it. Make sure the Dashboard is saved before sharing.
- Save dashboard: The current Dashboard will be saved with the current Dashboard name.
- Settings: Manage Dashboard settings and features such as Templating and Annotations.
Dashboards, panels, the building blocks of Grafana…
Dashboards are at the core of what Grafana is all about. Dashboards are composed of individual Panels arranged on a grid. Grafana ships with a variety of Panels. Grafana makes it easy to construct the right queries, and customize the display properties so that you can create the perfect Dashboard for your need. Each Panel can interact with data from any configured Grafana Data Source (currently Graphite, Prometheus, Elasticsearch, InfluxDB, OpenTSDB, MySQL, PostgreSQL, Microsoft SQL Server and AWS Cloudwatch). The Basic Concepts guide explores these key ideas in detail.
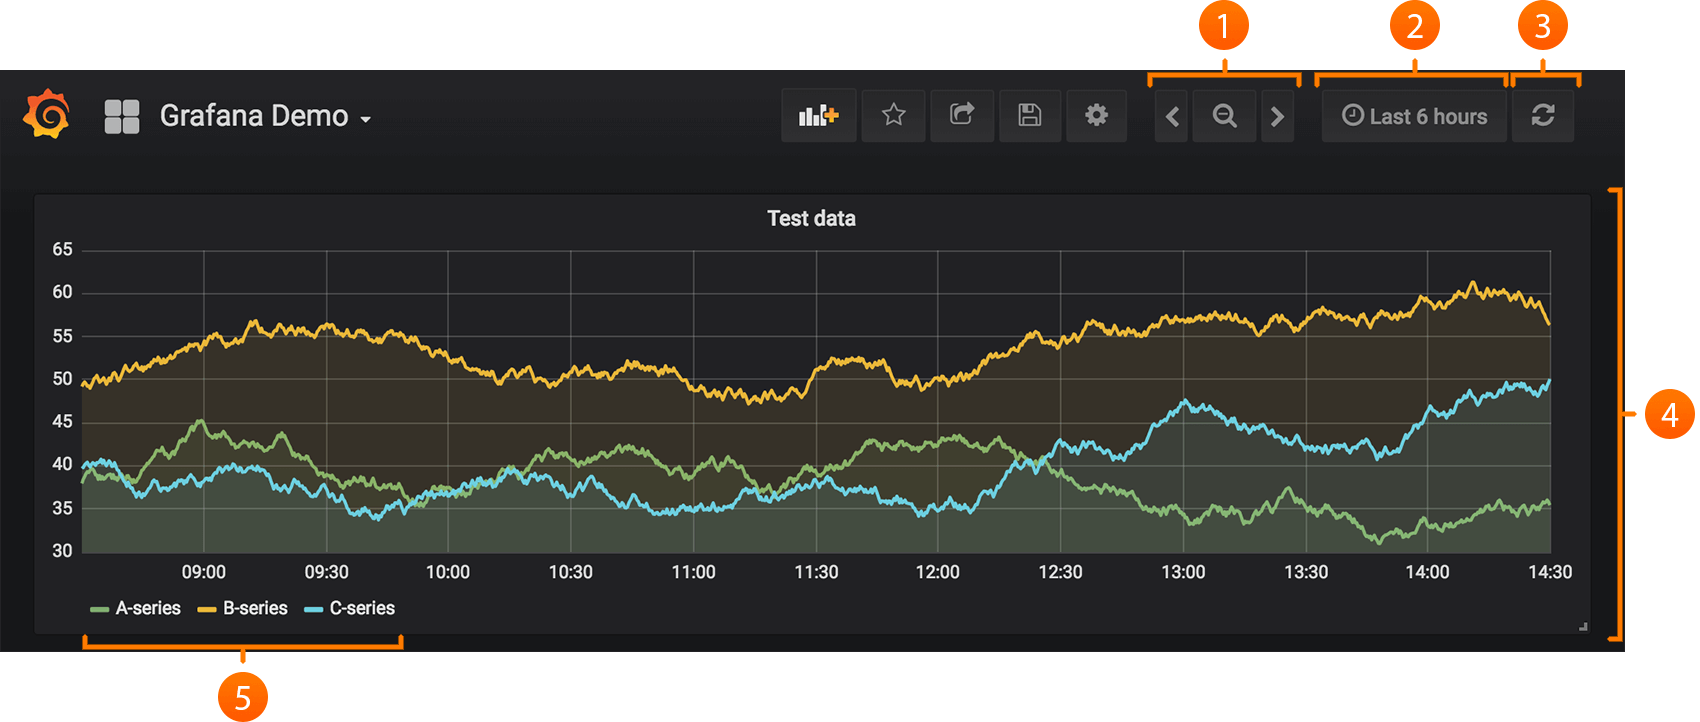
- Zoom out time range
- Time picker dropdown. Here you can access relative time range options, auto refresh options and set custom absolute time ranges.
- Manual refresh button. Will cause all panels to refresh (fetch new data).
- Dashboard panel. You edit panels by clicking the panel title.
- Graph legend. You can change series colors, y-axis and series visibility directly from the legend.
Adding and editing graphs and panels
- You add panels by clicking the Add panel icon on the top menu.
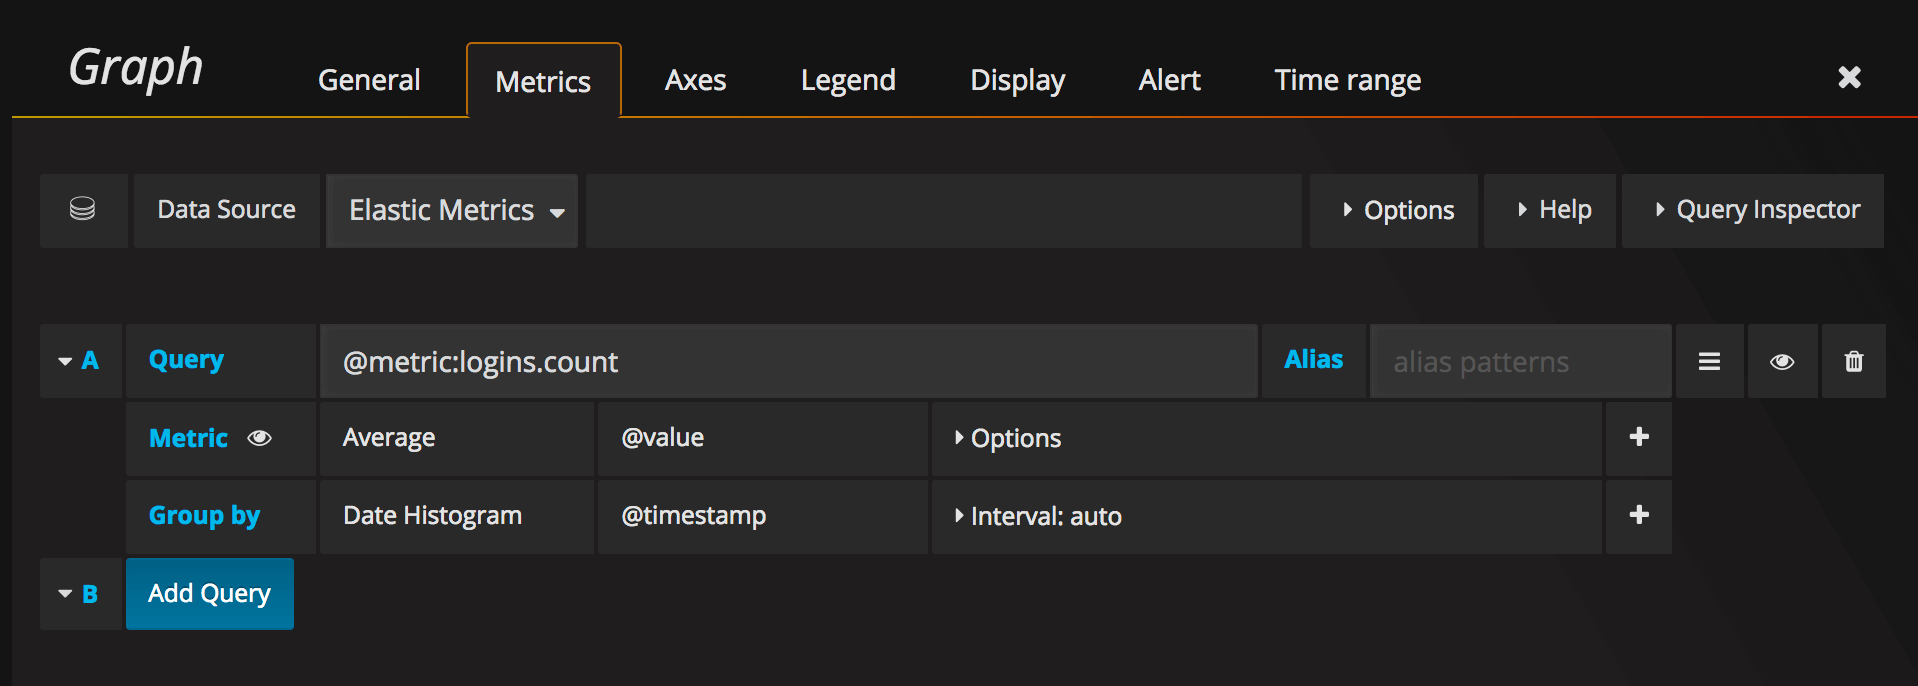
- To edit the graph you click on the graph title to open the panel menu, then
Edit. - This should take you to the
Metricstab. In this tab you should see the editor for your default data source.
When you click the Metrics tab, you are presented with a Query Editor that is specific to the Panel Data Source. Use the Query Editor to build your queries and Grafana will visualize them in real time.
Drag-and-Drop panels
You can Drag-and-Drop Panels by simply clicking and holding the Panel title, and drag it to its new location. You can also easily resize panels by clicking the (-) and (+) icons.
Tips and shortcuts
- Click the graph title and in the dropdown menu quickly change span or duplicate the panel.
- Click the Save icon in the menu to save the dashboard with a new name
- Click the Save icon in the menu and then advanced to export the dashboard to json file, or set it as your default dashboard.
- Click the colored icon in the legend to select series color
- Click series name in the legend to hide series
- Ctrl/Shift/Meta + Click legend name to hide other series
Grafana loves the keyboard
- Ctrl+S Saves the current dashboard
- Ctrl+F Opens the dashboard finder / search
- Ctrl+H Hides all controls (good for tv displays)
- Hit Escape to exit graph when in fullscreen or edit mode


