How to monitor an Apache CouchDB cluster with Grafana Cloud
We’re excited to introduce a dedicated Grafana Cloud integration for Apache CouchDB, a NoSQL document database that stores data in a JSON-based document format.
Known for its scalability, availability, and easy replication of data across multiple servers, Apache CouchDB comes with a whole host of features designed to make it easy to run resilient distributed systems, with built-in bi-direcitonal replication allowing for simple replication across multiple servers and data centers. And with this new solution, you can easily monitor the status of database reads/writes, request latencies, request rates, and much more.
Let’s walk through how to easily set up a Grafana Cloud account and start monitoring your Apache CouchDB cluster!
How to configure Apache CouchDB integration with Grafana Cloud
The Apache CouchDB integration makes use of Apache CouchDB’s built-in Prometheus metrics endpoint, and it uses the Grafana Agent so it is easier for you to run it in your environment and start collecting metrics with a single agent and configuration. To start monitoring your Apache CouchDB cluster with Grafana Cloud, follow these simple steps:
- A Grafana Cloud account is required to use the Apache CouchDB integration. If you don’t have a Grafana Cloud account, you can sign up for a forever-free account today.
- In your Grafana instance on Grafana Cloud use the left-side navigation to get to the Connections Console (Home > Connections > Connect data).
- Install the Apache CouchDB Infrastructure Integration and configure the Grafana Agent to collect logs and metrics from it. Please refer to our documentation on how to install and manage integrations for more information. And for details around configuring Grafana Agent for this integration, refer to the corresponding documentation.
Start monitoring Apache CouchDB
After the integration is installed, you will see two pre-built dashboards for Apache CouchDB and a set of 10 relevant alerts automatically installed into your Grafana Cloud account.
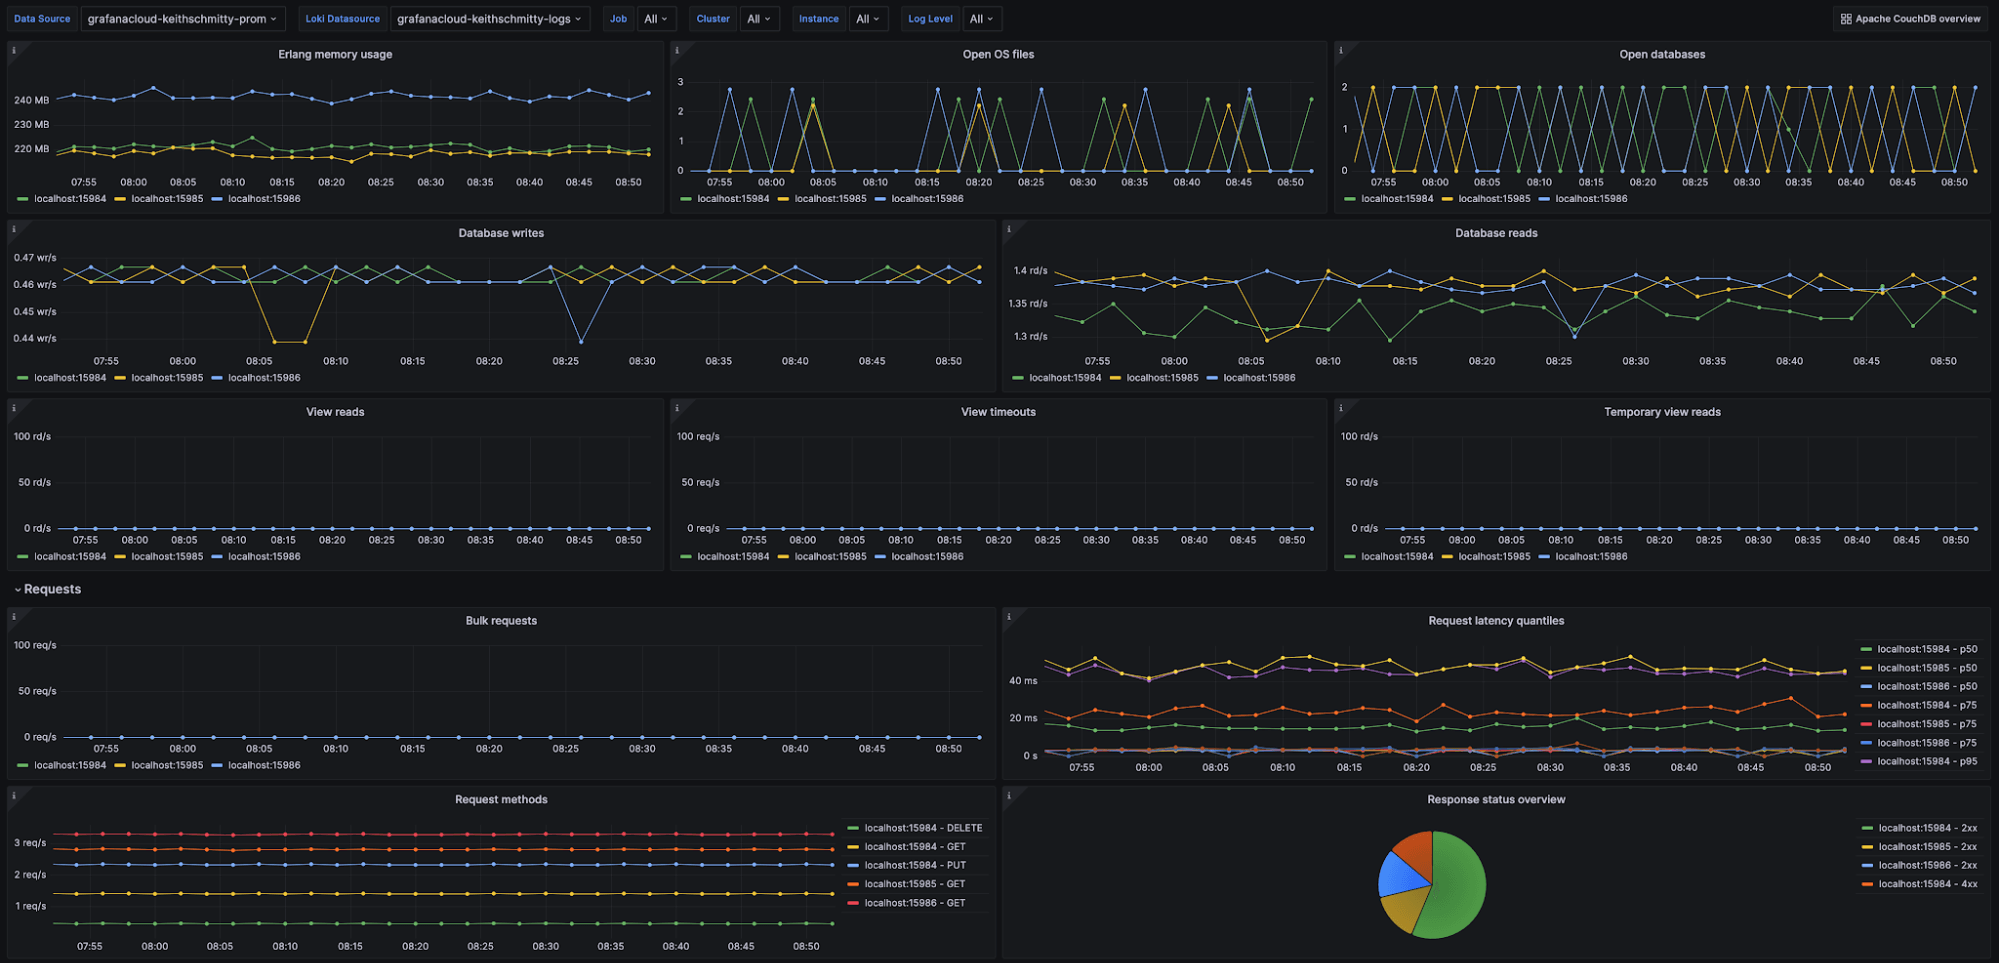
Apache CouchDB Overview dashboard
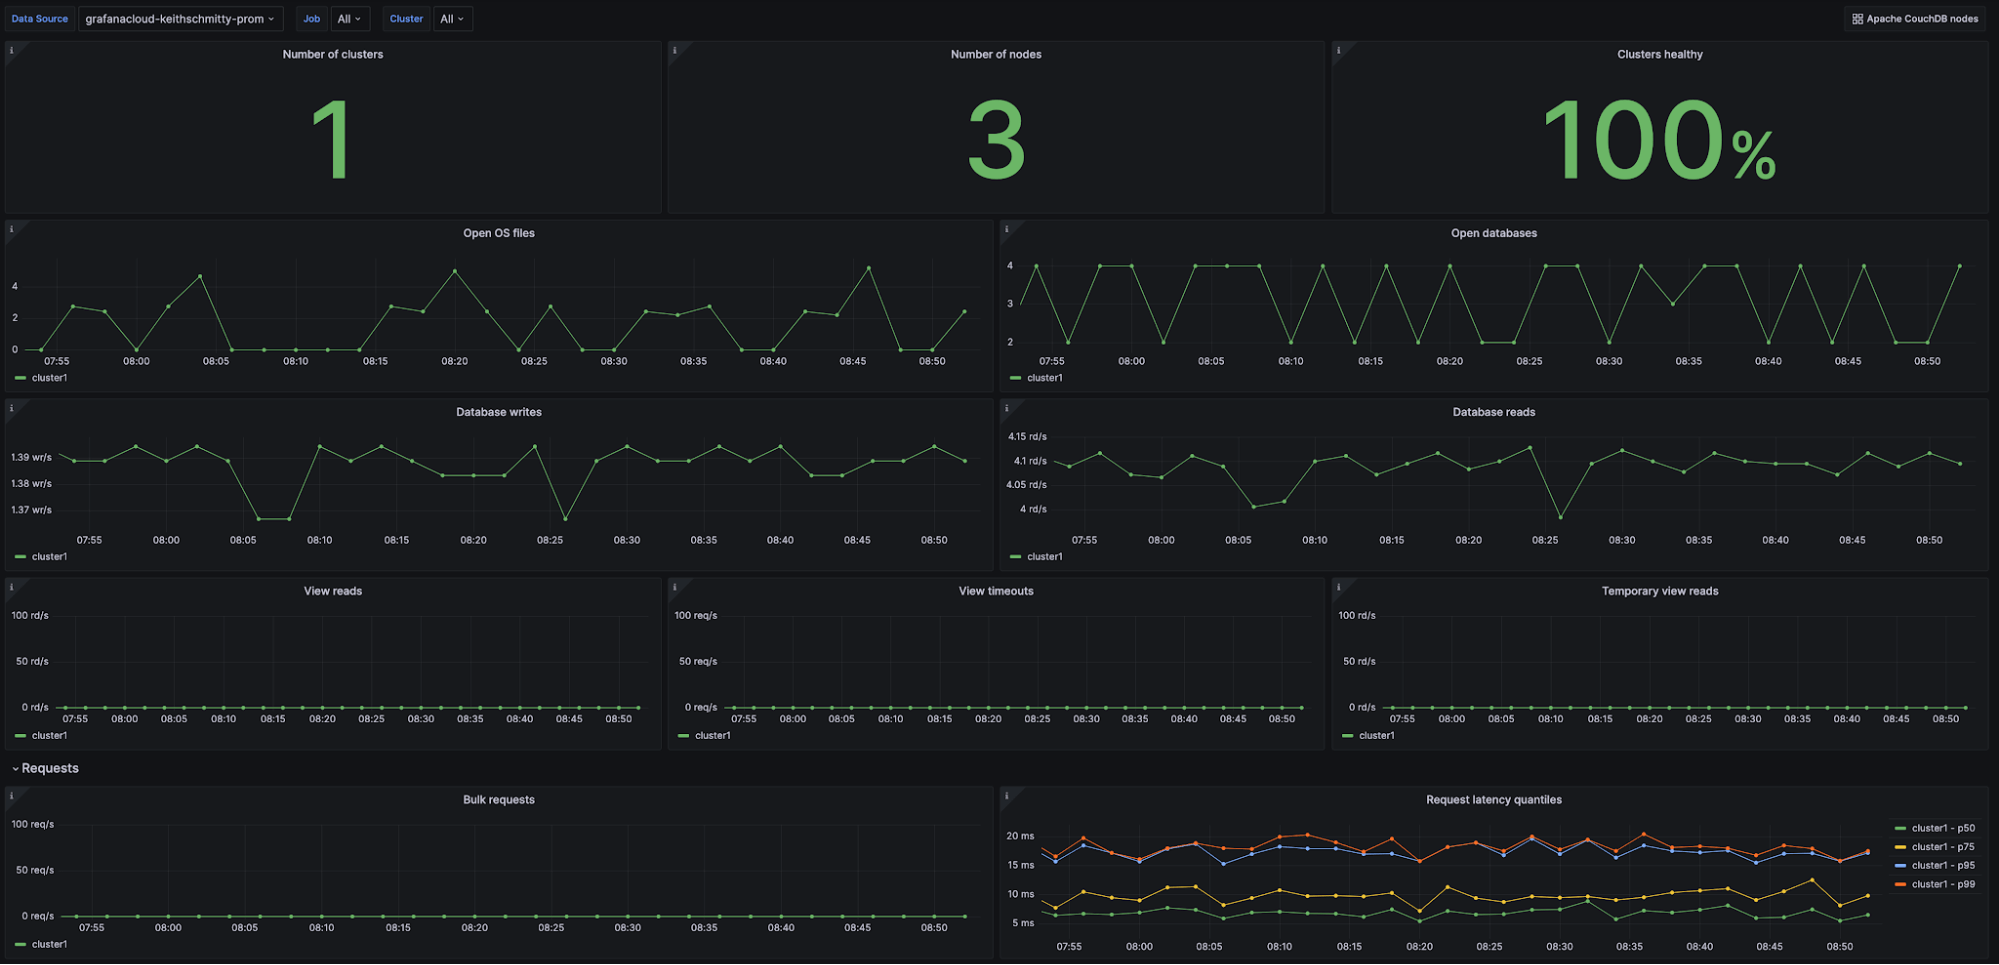
The Apache CouchDB Overview dashboard provides you with a high-level view of one or all of your CouchDB clusters. You can view how many clusters and nodes are currently being monitored, along with their health status.
Aside from multiple panels for digging into request latencies, you can also see critical information regarding the number of open databases and files, as well as the throughput of reads and writes.
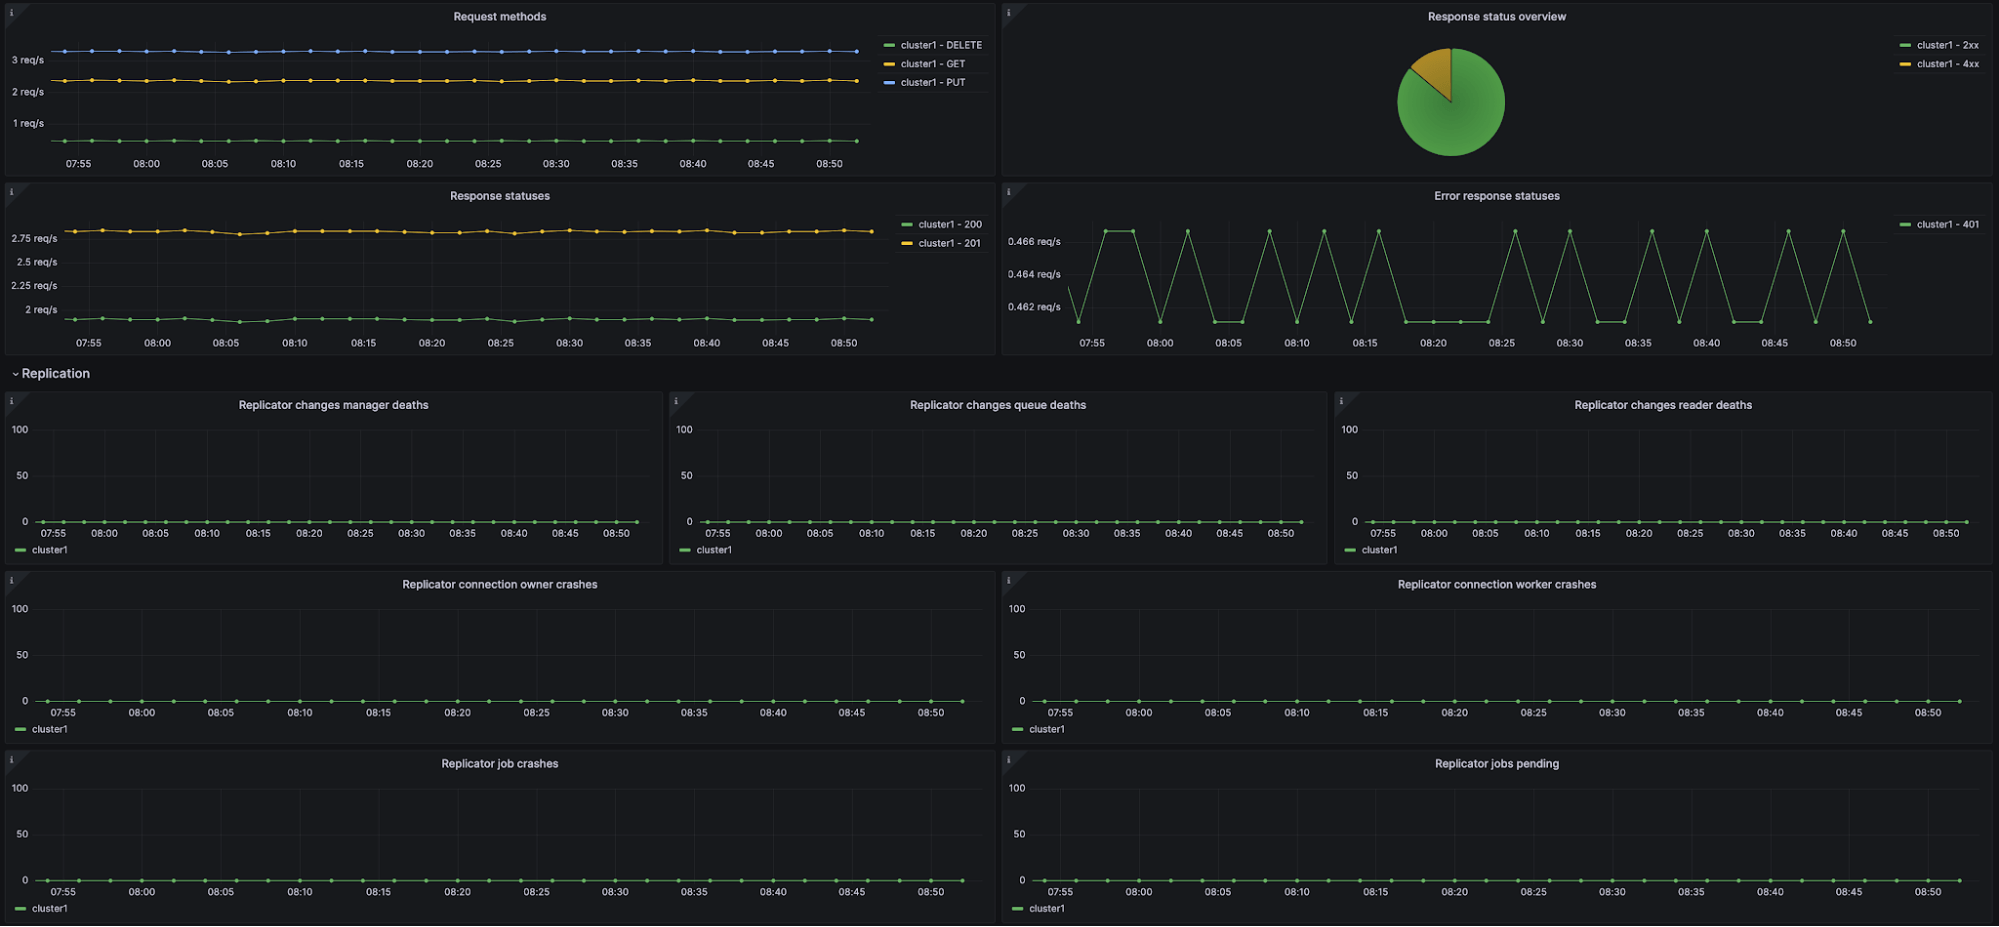
Additionally, a number of panels are included to specifically monitor the replication state of your cluster(s), with easily available data on replication queue status, replication connection crashes of both owners and workers, and the number of pending replication jobs.
The key metrics for this dashboard are the following:
couchdb_open_os_files_totalcouchdb_database_writes_totalcouchdb_database_reads_totalcouchdb_request_time_secondscouchdb_httpd_status_codescouchdb_couch_replicator_connection_owner_crashes_totalcouchdb_couch_replicator_jobs_pending
Apache CouchDB Nodes dashboard
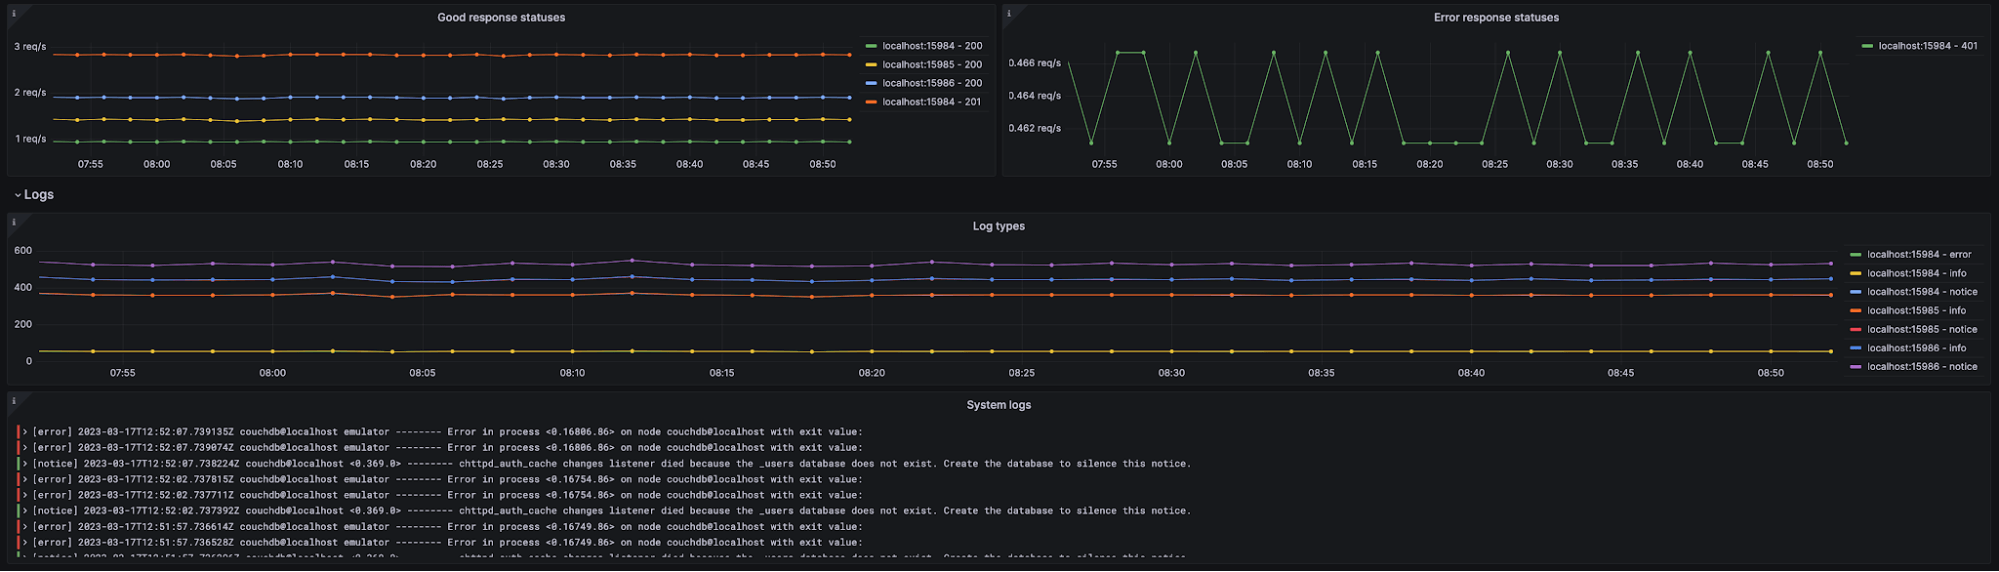
The Apache CouchDB Nodes dashboard provides a drill-down view of the information present on the overview dashboard, on a per-node basis, along with node-specific metrics that are helpful in observing the health of any given node in your Apache CouchDB cluster.
The key metrics for this dashboard are the following:
couchdb_open_os_files_totalcouchdb_database_writes_totalcouchdb_database_reads_totalcouchdb_request_time_secondscouchdb_couch_log_requests_total
And finally, you can inspect your CouchDB node system logs directly from the dashboard, as seen below:
Apache CouchDB alerts
The Apache CouchDB integration for Grafana Cloud includes a set of 10 alerting rules that were created to help you monitor your Apache CouchDB deployment. The alerts cover several distinct areas, such as cluster health, incoming request status codes, and replication status within distinct CouchDB instances in the cluster.
The following alerts are a sample of what is included, with the full list available in the Apache CouchDB integration documentation.
Apache CouchDB Unhealthy Cluster
This alert monitors the boolean metric couchdb_couch_replicator_cluster_is_stable, replacing the typical up metric for measuring if the deployment is healthy. If a 0 (unhealthy) is observed for more than five minutes, a critical alert is fired.
Apache CouchDB High 5xx Response Codes
This alert monitors the couchdb_httpd_status_codes metric and will alert if the percentage of HTTP 5xx status codes in incoming requests exceeds 0% over the last five minutes.
Apache CouchDB High Request Latency
This alert monitors the metrics couchdb_request_time_seconds_sum and couchdb_request_time_seconds_count to establish if there is a high request latency, and will alert if it exceeds 500ms.
Apache CouchDB Replicator Jobs Crashing
This alerts monitors the couchdb_couch_replicator_jobs_crashes_total metric and alerts if there are any reported crashes for replicator jobs over the last five minutes.
All alerts thresholds are default examples, and can be configured to meet the needs of your environment.
Start monitoring Apache CouchDB today
These dashboards and alerts can help you get your Apache CouchDB monitoring up and running in an easy way, which is the goal of this integration.
Give our Apache CouchDB integration a try, and let us know what you think! You can reach out to us in our Grafana Labs Community Slack in the #Integrations channel.
And if you’re looking to monitor additional environments, check out our solutions page for a list of other tools and platforms we can help you visualize and monitor with Grafana Cloud. At Grafana Labs, we have a “big tent” philosophy of providing a consistent experience across as many data sources and environments as possible, and we’re continuing to expand our integrations to support our community’s needs.
Grafana Cloud is the easiest way to get started with metrics, logs, traces, and dashboards. We have a generous forever-free tier and plans for every use case. Sign up for free now!