
Apache CouchDB integration for Grafana Cloud
Apache CouchDB is a NoSQL document-oriented database system known for its scalability, availability, and easy replication of data across multiple servers. This integration for Grafana Cloud allows users to collect metrics and system logs for monitoring an Apache CouchDB instance or clustered deployment. This integration also includes useful visualizations for both cluster and node metrics such as open databases, database writes/reads, request latency, request rates, response statuses, and replicator failure info.
This integration supports Apache CouchDB versions 3.2.x+.
This integration includes 10 useful alerts and 2 pre-built dashboards to help monitor and visualize Apache CouchDB metrics and logs.
Before you begin
In order for the integration to properly work, one of two configurations changes must occur. Either a user must be given metric permissions or the unauthenticated Prometheus endpoint must be setup.
Granting metrics permissions to a user
If an admin user and password is not planned on being used in the metric configuration, a CouchDB user must instead be given the _metrics role when creating a new user.
Example
curl http://localhost:5984/_users/org.couchdb.user:prom_user \
  -X PUT \
  -u admin:password \
  -H "Content-Type: application/json" \
  -d '{"name":"prom_user", "password":"prom_password", "roles": ["_metrics"], "type": "user"}'
Configuring the unauthenticated Prometheus endpoint
To enable the unauthenticated Prometheus endpoint for each node, CouchDB’s configuration file local.ini must be updated to include the correct Prometheus configuration.
Example
[prometheus]
additional_port = true
bind_address = 127.0.0.1
port = 17986
Install Apache CouchDB integration for Grafana Cloud
- In your Grafana Cloud stack, click Connections in the left-hand menu.
- Find Apache CouchDB and click its tile to open the integration.
- Review the prerequisites in the Configuration Details tab and set up Grafana Alloy to send Apache CouchDB metrics and logs to your Grafana Cloud instance.
- Click Install to add this integration’s pre-built dashboards and alerts to your Grafana Cloud instance, and you can start monitoring your Apache CouchDB setup.
Configuration snippets for Grafana Alloy
Advanced mode
The following snippets provide examples to guide you through the configuration process.
To instruct Grafana Alloy to scrape your Apache CouchDB instances, manually copy and append the snippets to your alloy configuration file, then follow subsequent instructions.
Advanced metrics snippets
discovery.relabel "metrics_integrations_integrations_apache_couchdb" {
	targets = concat(
		[{
			__address__ = "<your-node-hostname1>:5984",
		}],
		[{
			__address__ = "<your-node-hostname2>:5984",
		}],
		[{
			__address__ = "<your-node-hostname3>:5984",
		}],
	)

	rule {
		target_label = "couchdb_cluster"
		replacement  = "<your-cluster-name>"
	}

	rule {
		target_label = "instance"
		replacement  = constants.hostname
	}
}

prometheus.scrape "metrics_integrations_integrations_apache_couchdb" {
	targets      = discovery.relabel.metrics_integrations_integrations_apache_couchdb.output
	forward_to   = [prometheus.remote_write.metrics_service.receiver]
	job_name     = "integrations/apache-couchdb"
	metrics_path = "/_node/_local/_prometheus"

	basic_auth {
		username = "<couchdb_user>"
		password = "<couchdb_password>"
	}
}
To monitor your Apache CouchDB instance, you must use a discovery.relabel component to discover your Apache CouchDB Prometheus endpoint and apply appropriate labels, followed by a prometheus.scrape component to scrape it.
Configure the following properties within each discovery.relabel component:
__address__: The address to your Apache CouchDB Prometheus metrics endpoint. The ports for the targets should be changed based on if you are using the authenticated endpoint (default5984) or the unauthenticated Prometheus endpoint (default17986).instancelabel:constants.hostnamesets theinstancelabel to your Grafana Alloy server hostname. If that is not suitable, change it to a value uniquely identifies this Apache CouchDB instance. Make sure this label value is the same for all telemetry data collected for this instance.couchdb_cluster: Thecouchdb_clusterlabel to group your Apache CouchDB instances within a cluster. Set the same value for all nodes within your cluster.
If you have multiple Apache CouchDB servers to scrape, configure one discovery.relabel for each and scrape them by including each under targets within the prometheus.scrape component.
Beware that the prometheus.scrape component must hold the auth information if your are running an autheticated Prometheus endpoint. Check the component documentation for the different auth options.
Advanced logs snippets
darwin
local.file_match "logs_integrations_integrations_apache_couchdb" {
	path_targets = [{
		__address__     = "localhost",
		__path__        = "/var/log/couchdb/couchdb.log",
		couchdb_cluster = "<your-cluster-name>",
		instance        = constants.hostname,
		job             = "integrations/apache-couchdb",
	}]
}

loki.process "logs_integrations_integrations_apache_couchdb" {
	forward_to = [loki.write.grafana_cloud_loki.receiver]

	stage.multiline {
		firstline     = "\\[[a-z]+\\] \\d+-\\d+-\\d+T\\d+:\\d+:\\d+\\.\\d+"
		max_lines     = 0
		max_wait_time = "3s"
	}
}

loki.source.file "logs_integrations_integrations_apache_couchdb" {
	targets    = local.file_match.logs_integrations_integrations_apache_couchdb.targets
	forward_to = [loki.process.logs_integrations_integrations_apache_couchdb.receiver]
}
To monitor your Apache CouchDB instance logs, you will use a combination of the following components:
- local.file_match defines where to find the log file to be scraped. Change the following properties according to your environment:
__address__: The Apache CouchDB instance address__path__: The path to the log file.instancelabel:constants.hostnamesets theinstancelabel to your Grafana Alloy server hostname. If that is not suitable, change it to a value uniquely identifies this Apache CouchDB instance. Make sure this label value is the same for all telemetry data collected for this instance.couchdb_cluster: Thecouchdb_clusterlabel to group your Apache CouchDB instances within a cluster. Set the same value for all nodes within your cluster.
- loki.process defines how to process logs before sending it to Loki.
- loki.source.file sends logs to Loki.
On Linux, you will also need to add the alloy user to the couchdb group to get logs. Run the following command to configure the user as required:
sudo usermod -a -G couchdb alloylinux
local.file_match "logs_integrations_integrations_apache_couchdb" {
	path_targets = [{
		__address__     = "localhost",
		__path__        = "/var/log/couchdb/couchdb.log",
		couchdb_cluster = "<your-cluster-name>",
		instance        = constants.hostname,
		job             = "integrations/apache-couchdb",
	}]
}

loki.process "logs_integrations_integrations_apache_couchdb" {
	forward_to = [loki.write.grafana_cloud_loki.receiver]

	stage.multiline {
		firstline     = "\\[[a-z]+\\] \\d+-\\d+-\\d+T\\d+:\\d+:\\d+\\.\\d+"
		max_lines     = 0
		max_wait_time = "3s"
	}
}

loki.source.file "logs_integrations_integrations_apache_couchdb" {
	targets    = local.file_match.logs_integrations_integrations_apache_couchdb.targets
	forward_to = [loki.process.logs_integrations_integrations_apache_couchdb.receiver]
}
To monitor your Apache CouchDB instance logs, you will use a combination of the following components:
- local.file_match defines where to find the log file to be scraped. Change the following properties according to your environment:
__address__: The Apache CouchDB instance address__path__: The path to the log file.instancelabel:constants.hostnamesets theinstancelabel to your Grafana Alloy server hostname. If that is not suitable, change it to a value uniquely identifies this Apache CouchDB instance. Make sure this label value is the same for all telemetry data collected for this instance.couchdb_cluster: Thecouchdb_clusterlabel to group your Apache CouchDB instances within a cluster. Set the same value for all nodes within your cluster.
- loki.process defines how to process logs before sending it to Loki.
- loki.source.file sends logs to Loki.
On Linux, you will also need to add the alloy user to the couchdb group to get logs. Run the following command to configure the user as required:
sudo usermod -a -G couchdb alloywindows
local.file_match "logs_integrations_integrations_apache_couchdb" {
	path_targets = [{
		__address__     = "localhost",
		__path__        = "/Program Files/Apache Software Foundation/CouchDB/var/log/couchdb.log",
		couchdb_cluster = "<your-cluster-name>",
		instance        = constants.hostname,
		job             = "integrations/apache-couchdb",
	}]
}

loki.process "logs_integrations_integrations_apache_couchdb" {
	forward_to = [loki.write.grafana_cloud_loki.receiver]

	stage.multiline {
		firstline     = "\\[[a-z]+\\] \\d+-\\d+-\\d+T\\d+:\\d+:\\d+\\.\\d+"
		max_lines     = 0
		max_wait_time = "3s"
	}
}

loki.source.file "logs_integrations_integrations_apache_couchdb" {
	targets    = local.file_match.logs_integrations_integrations_apache_couchdb.targets
	forward_to = [loki.process.logs_integrations_integrations_apache_couchdb.receiver]
}
To monitor your Apache CouchDB instance logs, you will use a combination of the following components:
- local.file_match defines where to find the log file to be scraped. Change the following properties according to your environment:
__address__: The Apache CouchDB instance address__path__: The path to the log file.instancelabel:constants.hostnamesets theinstancelabel to your Grafana Alloy server hostname. If that is not suitable, change it to a value uniquely identifies this Apache CouchDB instance. Make sure this label value is the same for all telemetry data collected for this instance.couchdb_cluster: Thecouchdb_clusterlabel to group your Apache CouchDB instances within a cluster. Set the same value for all nodes within your cluster.
- loki.process defines how to process logs before sending it to Loki.
- loki.source.file sends logs to Loki.
Kubernetes instructions
Before you begin with Kubernetes
Please note: These instructions assume the use of the Kubernetes Monitoring Helm chart
In order for the integration to properly work, one of two configurations changes must occur. Either a user must be given metric permissions or the unauthenticated Prometheus endpoint must be setup.
Granting metrics permissions to a user
If an admin user and password is not planned on being used in the metric configuration, a CouchDB user must instead be given the _metrics role when creating a new user.
Example
curl http://localhost:5984/_users/org.couchdb.user:prom_user \
  -X PUT \
  -u admin:password \
  -H "Content-Type: application/json" \
  -d '{"name":"prom_user", "password":"prom_password", "roles": ["_metrics"], "type": "user"}'
Configuring the unauthenticated Prometheus endpoint
To enable the unauthenticated Prometheus endpoint for each node, CouchDB’s configuration file local.ini must be updated to include the correct Prometheus configuration.
Example
[prometheus]
additional_port = true
bind_address = 127.0.0.1
port = 17986
Configuration snippets for Kubernetes Helm chart
The following snippets provide examples to guide you through the configuration process.
To scrape your Apache CouchDB instances, manually modify your Kubernetes Monitoring Helm chart with these configuration snippets.
Replace any values between the angle brackets <> in the provided snippets with your desired configuration values.
Metrics snippets
alloy-metrics:
    extraConfig: |-
        discovery.kubernetes "apache_couchdb" {
            role = "endpoints"
            selectors {
                role = "endpoints"
                label = "<apache_couchdb_pod_label>=<apache_couchdb_pod_label_value>"
            }
        }

        discovery.relabel "apache_couchdb" {
            targets = discovery.kubernetes.apache_couchdb.targets

            rule {
                source_labels = ["__meta_kubernetes_service_name","__meta_kubernetes_endpoint_port_name"]
                separator     = ":"
                regex         = ".*-couchdb:metrics"
                action        = "keep"
            }

            rule {
                replacement  = "<your-couchdb-cluster-name>"
                target_label = "couchdb_cluster"
            }
        }

        prometheus.scrape "apache_couchdb" {
            targets      = discovery.relabel.apache_couchdb.output
            metrics_path = "/_node/_local/_prometheus"
            forward_to   = [prometheus.remote_write.grafana_cloud_metrics.receiver]
            job_name     = "integrations/couchdb"
        }
Logs snippets
podLogs:
    extraDiscoveryRules: |-
        rule {
            source_labels = ["__meta_kubernetes_namespace","__meta_kubernetes_pod_name","__meta_kubernetes_pod_container_port_name"]
            separator     = ":"
            regex         = "sample-apps:.*-couchdb.*:metrics"
            replacement   = "couchdb"
            target_label  = "integration"
        }

        rule {
            source_labels = ["integration","__meta_kubernetes_pod_ip","__meta_kubernetes_pod_container_port_number"]
            separator   = ":"
            regex        = "couchdb:(.*):(.*)"
            replacement  = "$1:$2"
            target_label = "instance"
        }

    extraLogProcessingStages: |-
        stage.match {
            selector = "{integration=\\"couchdb\\"}"

            stage.static_labels {
                values = {
                    couchdb_cluster = "<your-couchdb-cluster-name>",
                    job             = "integrations/apache-cassandra",
                    log_type        = "couchdb",
                }
            }

            stage.labels {
                values = {
                    instance = null,
                }
            }
        }
Dashboards
The Apache CouchDB integration installs the following dashboards in your Grafana Cloud instance to help monitor your system.
- Apache CouchDB nodes
- Apache CouchDB overview
Apache CouchDB overview (1/2)
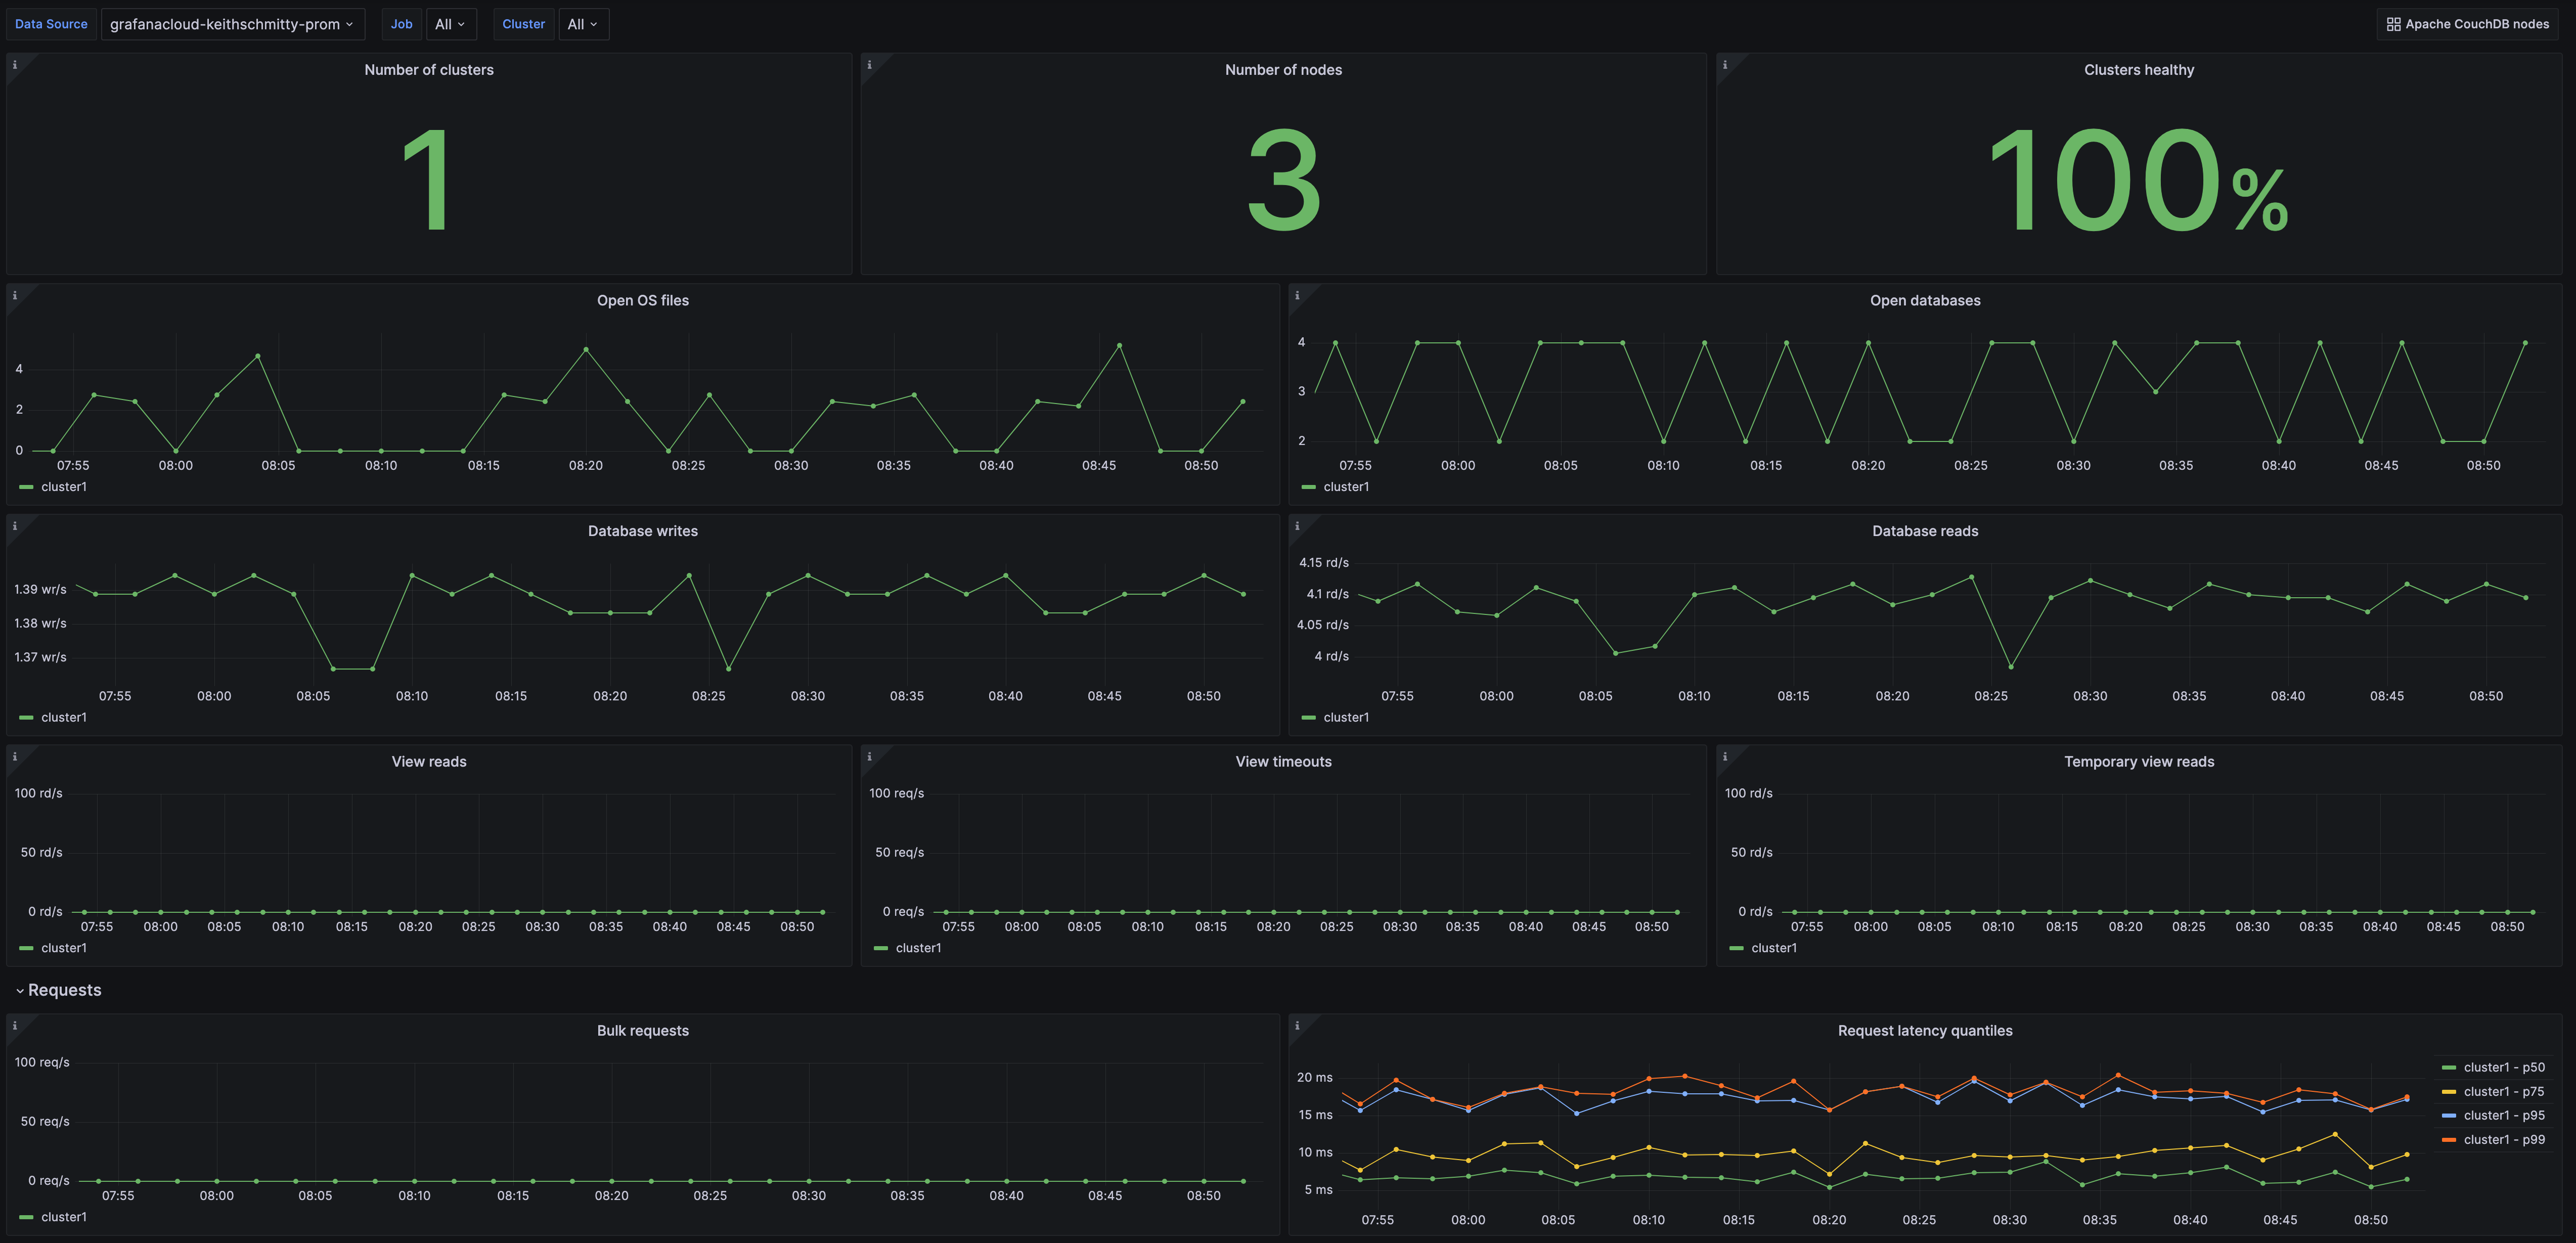
Apache CouchDB overview (2/2)
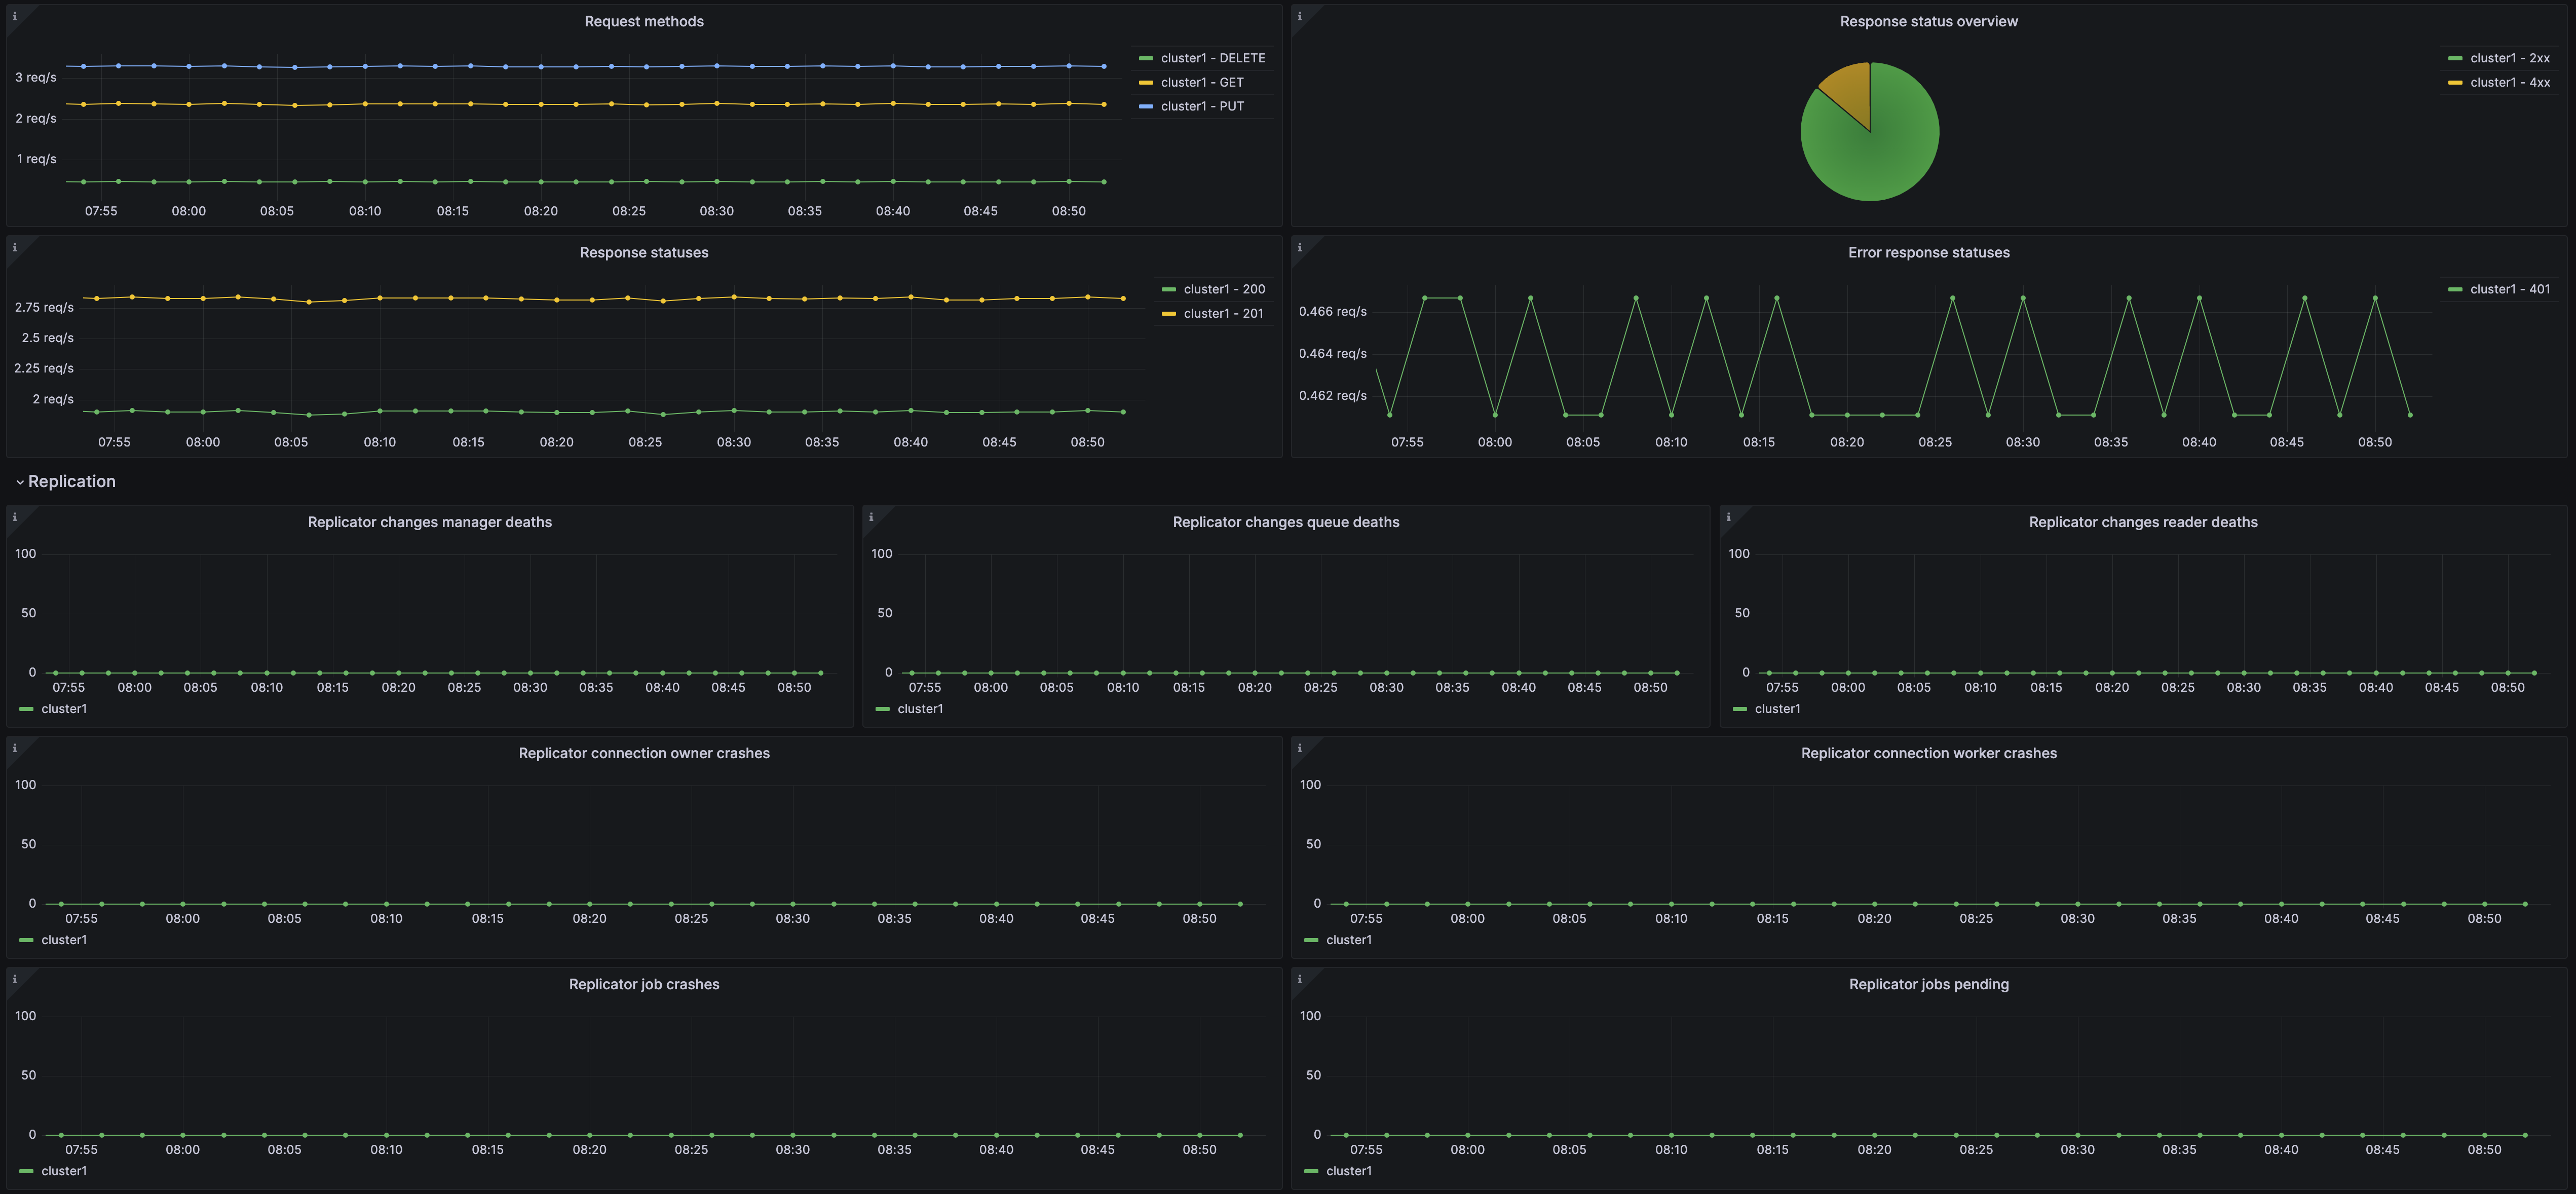
Apache CouchDB nodes (1/2)

Alerts
The Apache CouchDB integration includes the following useful alerts:
Metrics
The most important metrics provided by the Apache CouchDB integration, which are used on the pre-built dashboards and Prometheus alerts, are as follows:
- couchdb_couch_log_requests_total
- couchdb_couch_replicator_changes_manager_deaths_total
- couchdb_couch_replicator_changes_queue_deaths_total
- couchdb_couch_replicator_changes_reader_deaths_total
- couchdb_couch_replicator_cluster_is_stable
- couchdb_couch_replicator_connection_owner_crashes_total
- couchdb_couch_replicator_connection_worker_crashes_total
- couchdb_couch_replicator_jobs_crashes_total
- couchdb_couch_replicator_jobs_pending
- couchdb_database_reads_total
- couchdb_database_writes_total
- couchdb_erlang_memory_bytes
- couchdb_httpd_bulk_requests_total
- couchdb_httpd_request_methods
- couchdb_httpd_status_codes
- couchdb_httpd_temporary_view_reads_total
- couchdb_httpd_view_reads_total
- couchdb_httpd_view_timeouts_total
- couchdb_open_databases_total
- couchdb_open_os_files_total
- couchdb_request_time_seconds
- couchdb_request_time_seconds_count
- couchdb_request_time_seconds_sum
- up
Changelog
# 1.0.0 - May 2024

* Added cluster selector to dashboards for kubernetes support
* Added default cluster label to agent config
* Bump version to 1.0.0

# 0.0.3 - September 2023

* New Filter Metrics option for configuring the Grafana Agent, which saves on metrics cost by dropping any metric not used by this integration. Beware that anything custom built using metrics that are not on the snippet will stop working.
* New hostname relabel option, which applies the instance name you write on the text box to the Grafana Agent configuration snippets, making it easier and less error prone to configure this mandatory label.

# 0.0.2 - August 2023

* Add regex filter for logs datasource

# 0.0.1 - April 2023

* Initial release
Cost
By connecting your Apache CouchDB instance to Grafana Cloud, you might incur charges. To view information on the number of active series that your Grafana Cloud account uses for metrics included in each Cloud tier, see Active series and dpm usage and Cloud tier pricing.


