Cost attribution in Grafana Cloud: Manage spend across observability and testing workflows Grafana CloudCost managementSynthetic monitoringPerformance Testing
Grafana Labs named a Leader again in the 2026 Gartner® Magic Quadrant™ for Observability PlatformsObservabilityGrafana Cloud
Building an end-to-end reliability testing strategy with Grafana CloudPerformance TestingGrafana CloudSynthetic monitoringFrontend observabilityGrafana Cloud k6
Full-stack observability in Grafana Cloud: How to investigate issues across services and infrastructure Grafana CloudDrilldown
How to generate real-world load tests using Grafana Cloud k6 and production telemetryGrafana Cloud k6Grafana CloudLoad testingPerformance Testing
Spend less time on repetitive tasks with the new automation feature in Grafana AssistantAIGrafana Cloud
Generate test scripts from natural language with Grafana Assistant: introducing k6 Script AuthoringGrafana CloudGrafana Cloud k6AIPerformance Testing
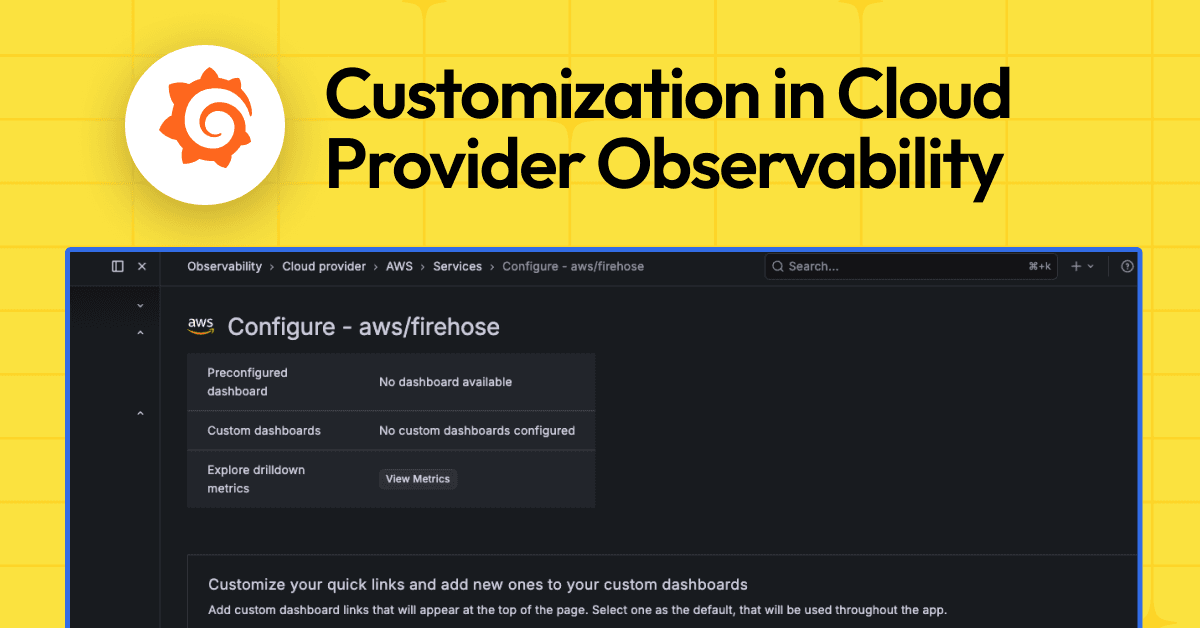
Customize preconfigured views for AWS, Azure, and Google Cloud with Cloud Provider Observability in Grafana CloudCloud Provider ObservabilityGrafana Cloud
AI Observability in Grafana Cloud: A complete solution for monitoring your agentic workloadsAIGrafana Cloud
Monitor Databricks with Grafana Cloud for instant visibility into your workloadsIntegrationsGrafana Cloud
A faster way to pinpoint performance bottlenecks: Using Profiles Drilldown with Grafana Cloud Knowledge GraphDrilldownGrafana Cloud
Query fair usage in Grafana Cloud: What it is and how it affects your logs observability practiceLogsGrafana Cloud
How OpenRouter and Grafana Cloud bring observability to LLM-powered applicationsGrafana CloudAIIntegrations
Quickly go from exploration to action with new one-click integrations in Grafana DrilldownDrilldownGrafana Cloud
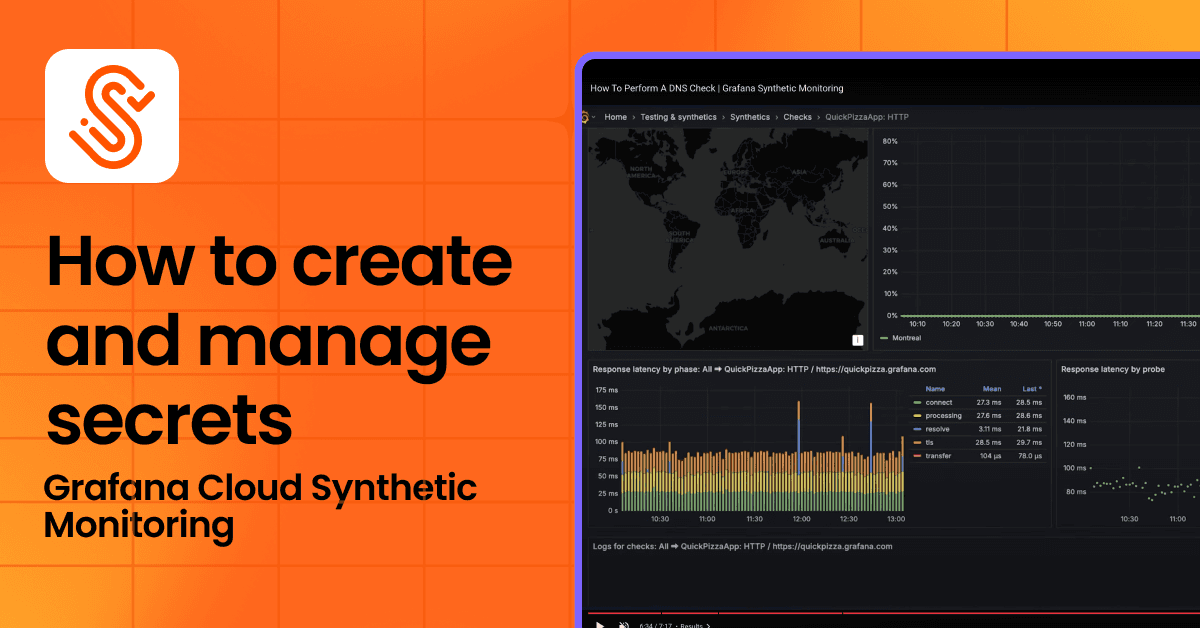
How to create and manage secrets with Grafana Cloud Synthetic MonitoringSynthetic monitoringGrafana Cloud
Build, buy, or open source? Understanding your options with Grafana’s AI-powered observabilityAIGrafana Cloud
Use AI to turn any JSON API into a dashboard in minutes with the Infinity data source plugin and Grafana AssistantAIGrafana Cloud