'Grafana's Big Tent' podcast: Anthropic on agentic coding, observability, and the future of software engineeringPodcastsAIObservability
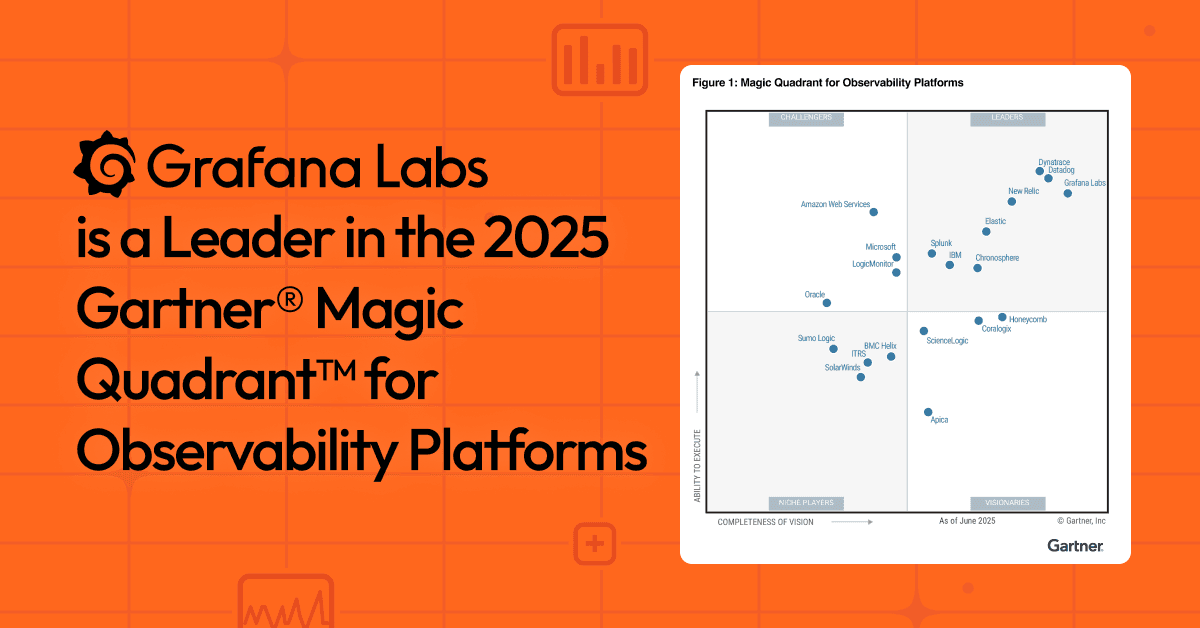
Grafana Labs named a Leader again in the 2025 Gartner® Magic Quadrant™ for Observability PlatformsObservabilityGrafana Cloud
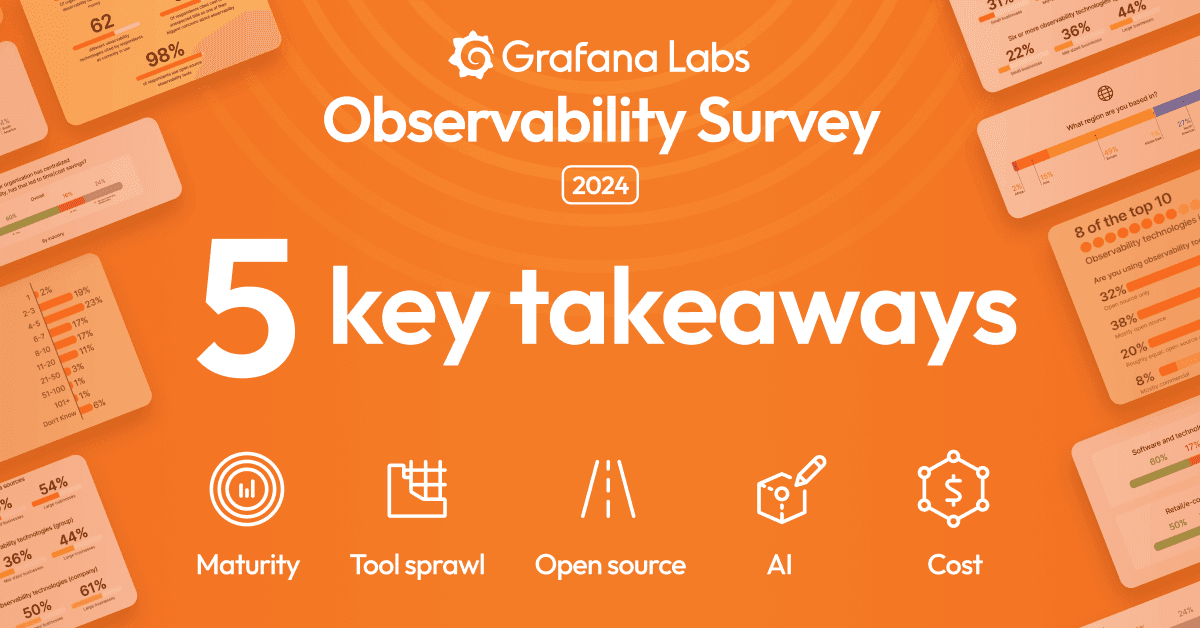
The state of observability in 2025: a deep dive on our third annual Observability SurveyObservability
How LATAM Airlines uses Grafana Cloud for real-time observability that improves customers’ experiencesObservabilityGrafana CloudGrafana SLO
3D printing and observability: How Prusa Research monitors its huge printer farm with GrafanaObservabilityGrafana
Obirdability: How to build an observability system for bird songs 🎶ObservabilityCommunityLokiMimirGrafana Cloud
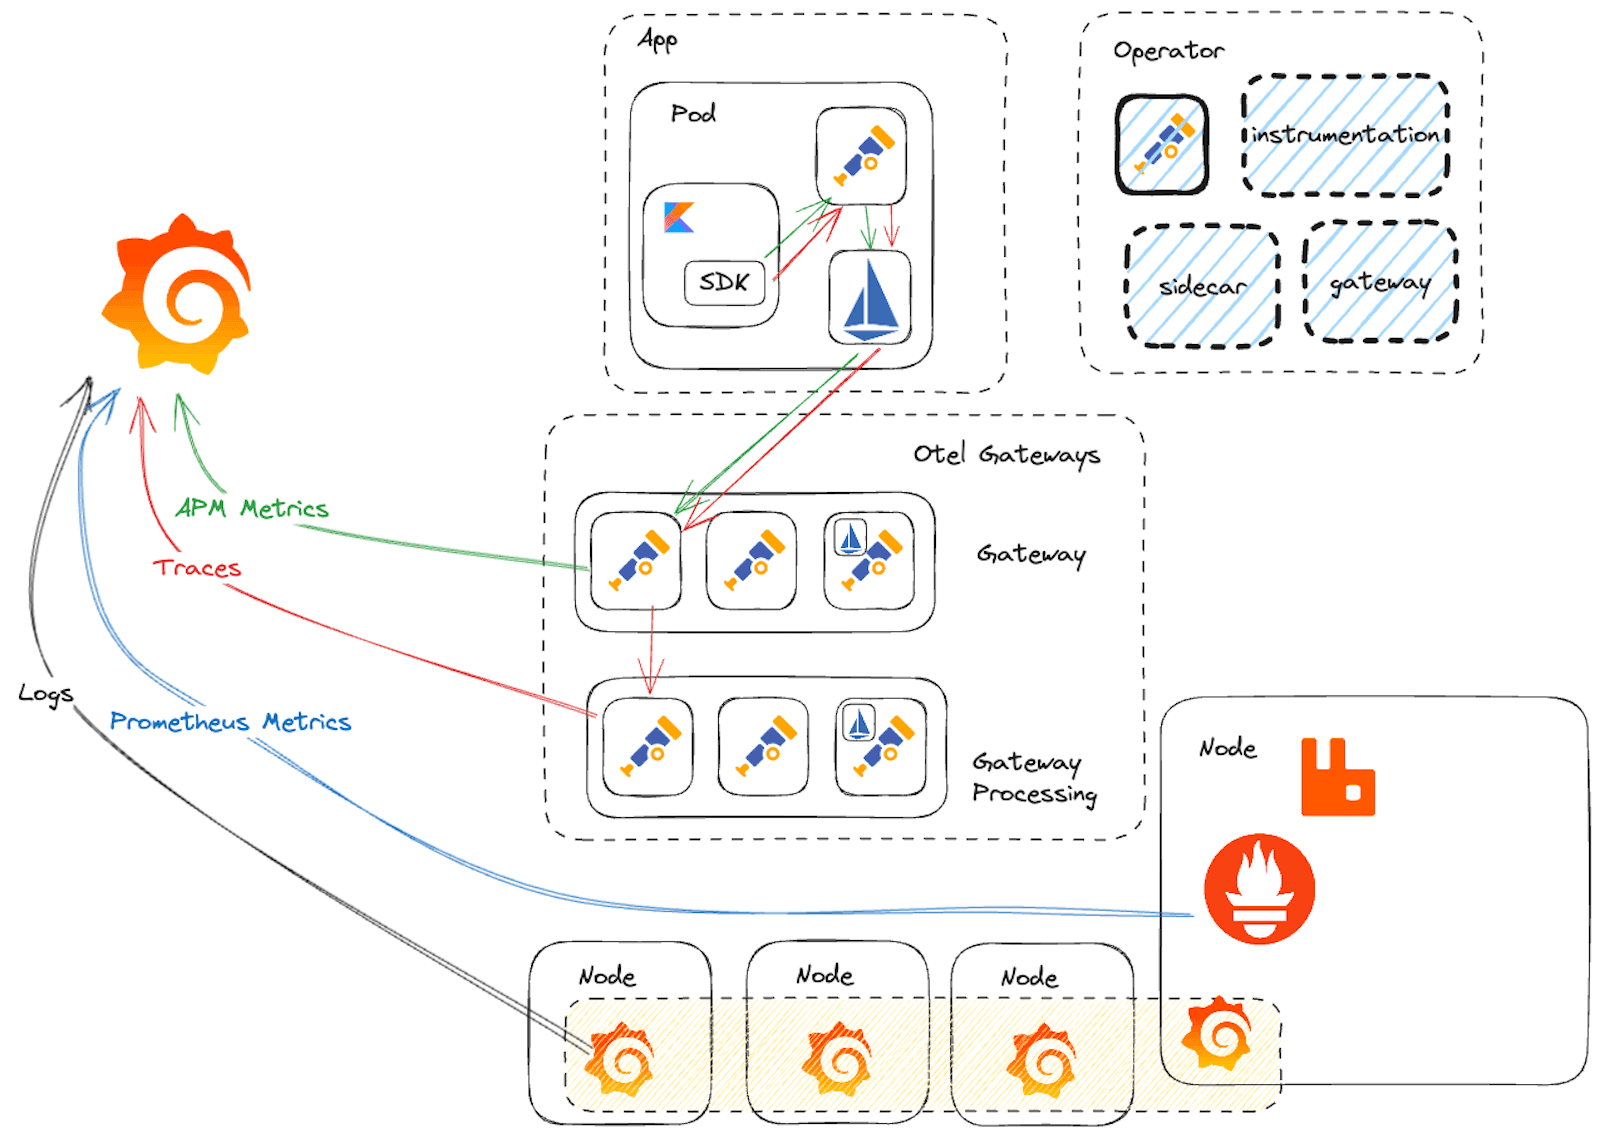
How ComplyAdvantage built a more flexible observability strategy with OpenTelemetry and Grafana CloudOpenTelemetryGrafana CloudObservability
AWS Observability in Grafana Cloud: A simpler, more intuitive cloud monitoring appAWSObservabilityIntegrationsGrafana Cloud
Monitor Amazon EC2: key metrics for instances, regions, and more in one viewIntegrationsAWSObservability
Observability trends and predictions for 2024: CI/CD observability is in. Spiking costs are out.Observability
Get an early look at the 2024 Grafana Labs Observability Survey, and weigh in before it’s too lateCommunityObservability
What is CI/CD observability, and how are we paving the way for more observable pipelines?Observability
Reducing data center carbon emissions with Hardware Sentry, Grafana, and OpenTelemetryObservabilityOpenTelemetryOpen SourceCommunityGrafana