Enhancing authentication security: Inside Microsoft’s open source contribution to GrafanaSecurityOpen Source
Prometheus 3.0 and OpenTelemetry: a practical guide to storing and querying OTel dataPrometheusOpenTelemetryOpen Source
Grafana OpenTelemetry distributions: prioritizing simplicity, sticking to OSS valuesOpenTelemetryOpen SourceApplication observability
How to set up an open source database monitoring stack with Grafana CloudOpen SourceGrafana AlloyGrafana CloudPrometheus
Upgrade with confidence: Strategies for updating your self-hosted Grafana instanceGrafana EnterpriseOpen SourceGrafana
A guide to scaling OpenTelemetry Collectors across multiple hosts via AnsibleOpen SourceOpenTelemetryMonitoring
Grafana 10.3 release: Canvas panel updates, multi-stack data sources, and moreGrafanaGrafana EnterpriseAlertingOpen Source
Reducing data center carbon emissions with Hardware Sentry, Grafana, and OpenTelemetryObservabilityOpenTelemetryOpen SourceCommunityGrafana
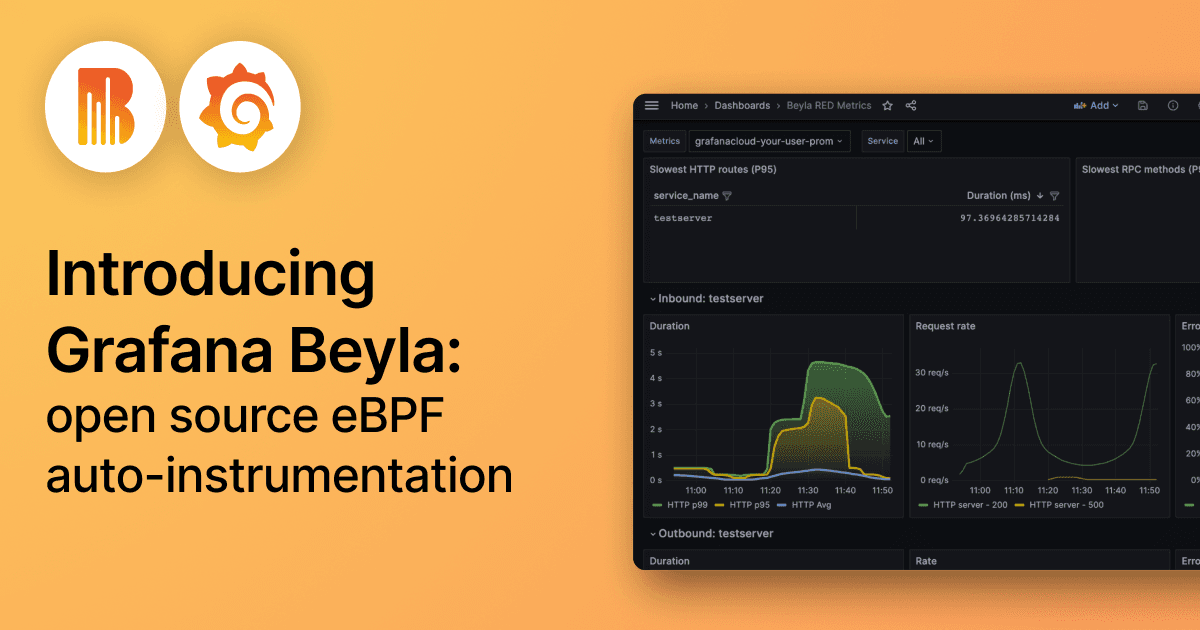
Introducing Grafana Beyla: open source ebpf auto-instrumentation for application observabilityOpen SourceeBPFApplication observability
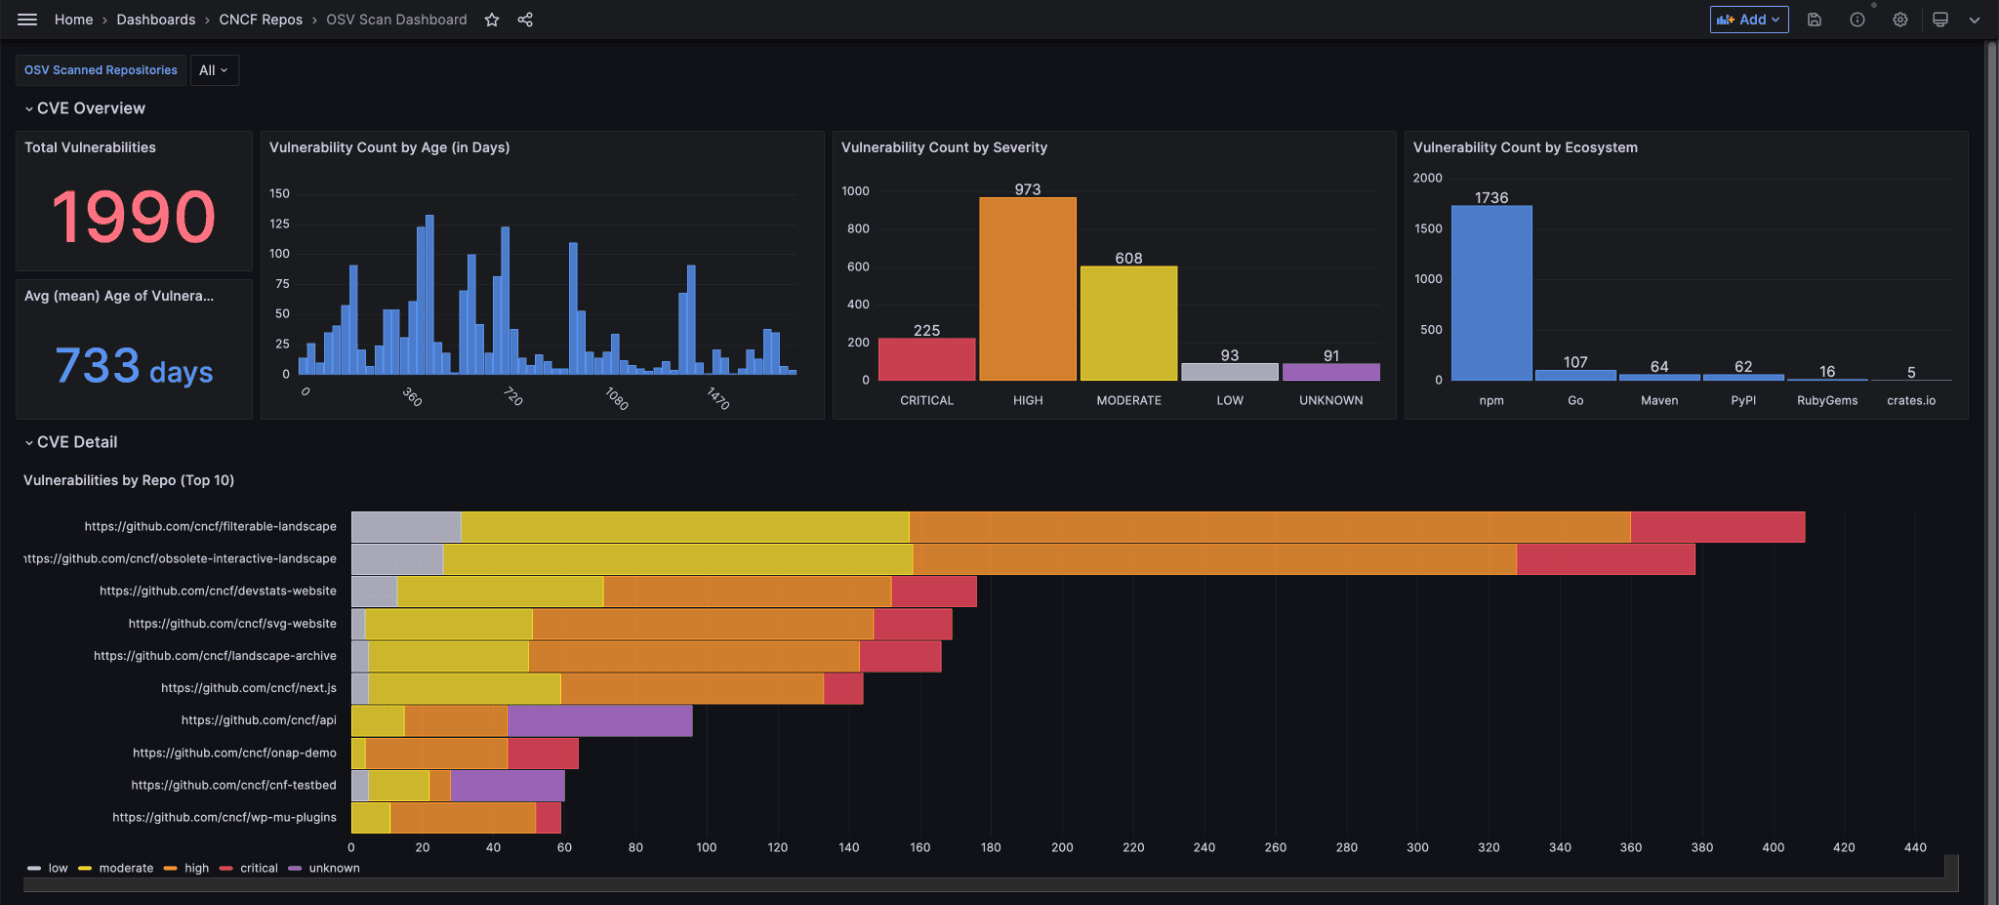
How to manage CVE security vulnerabilities with Grafana, MergeStat, and OSV-ScannerGrafanaOpen SourceSecurity
How Grafana Labs uses and contributes to OpenCost, the open source project for real-time cost monitoring in KubernetesKubernetesOpen Source
Troubleshoot in less than 60 seconds with Grafana: Inside NOS’s observability stackGrafanaPrometheusLokiOpen Source
Introducing Grafana OnCall OSS, on-call management for the open source communityGrafana OnCallOpen Source
Grafana Labs joins the CNCF Governing Board as a Platinum member of the open source foundationCompany newsOpen SourcePrometheus