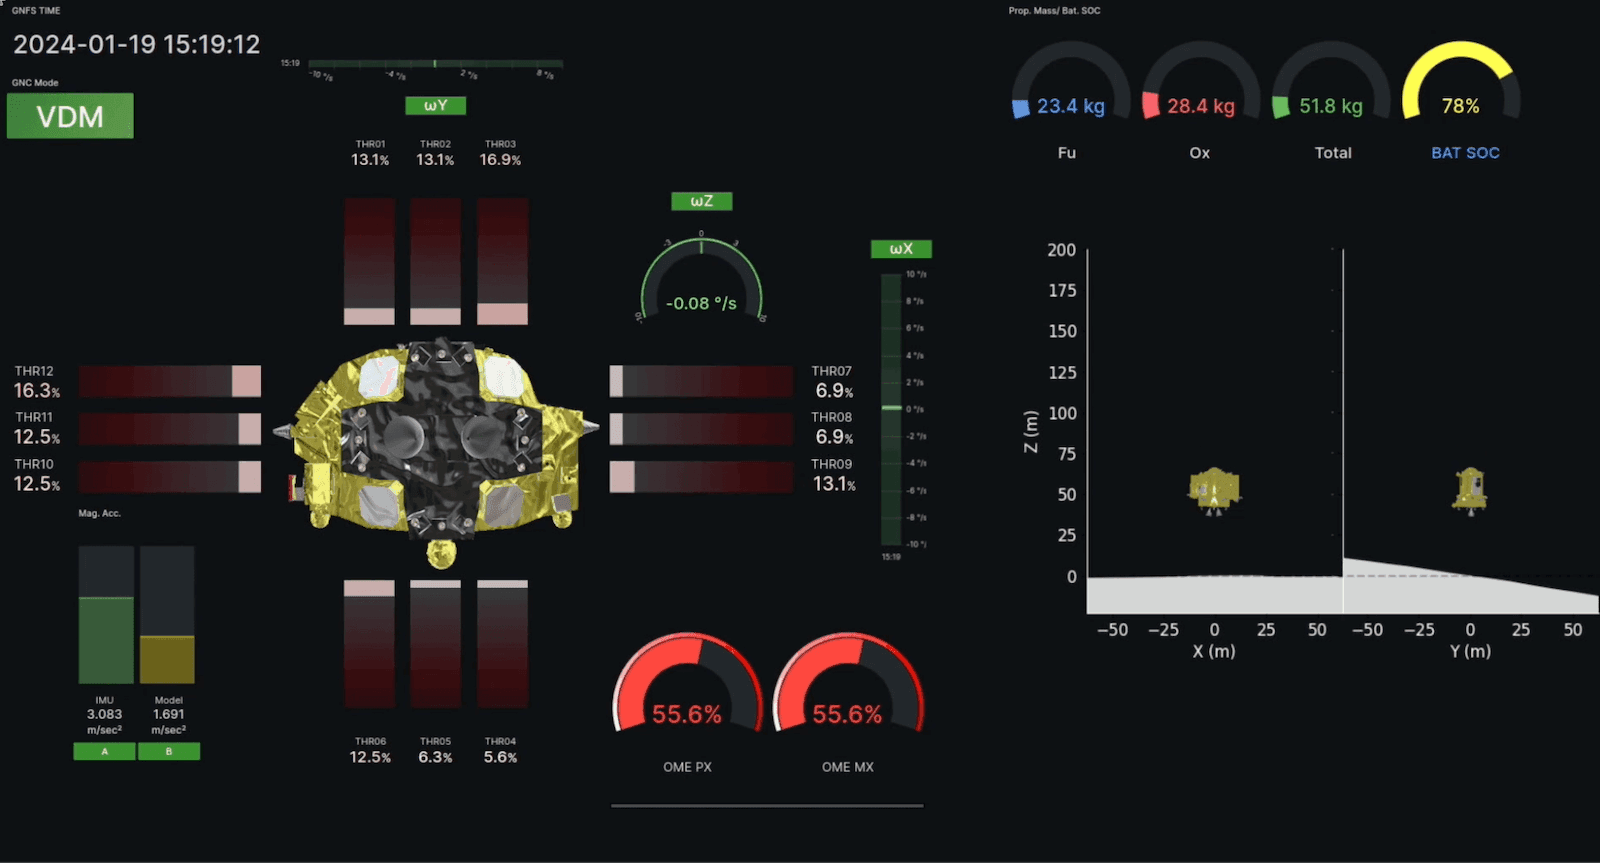
How Japan’s space agency used Grafana to monitor its first moon landing in real timeDashboardGrafanaMonitoring
Observing exchange rates: How to keep tabs on currencies during the summer travel seasonMonitoringGrafana
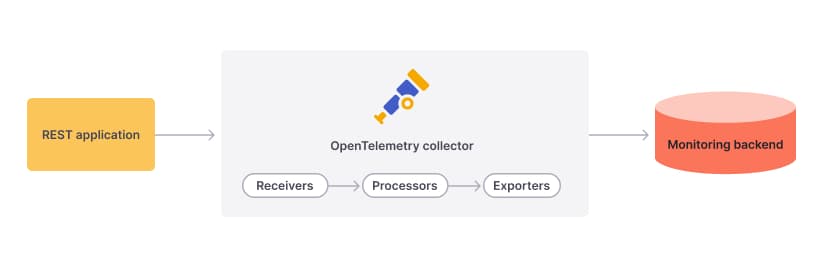
A guide to scaling OpenTelemetry Collectors across multiple hosts via AnsibleOpen SourceOpenTelemetryMonitoring
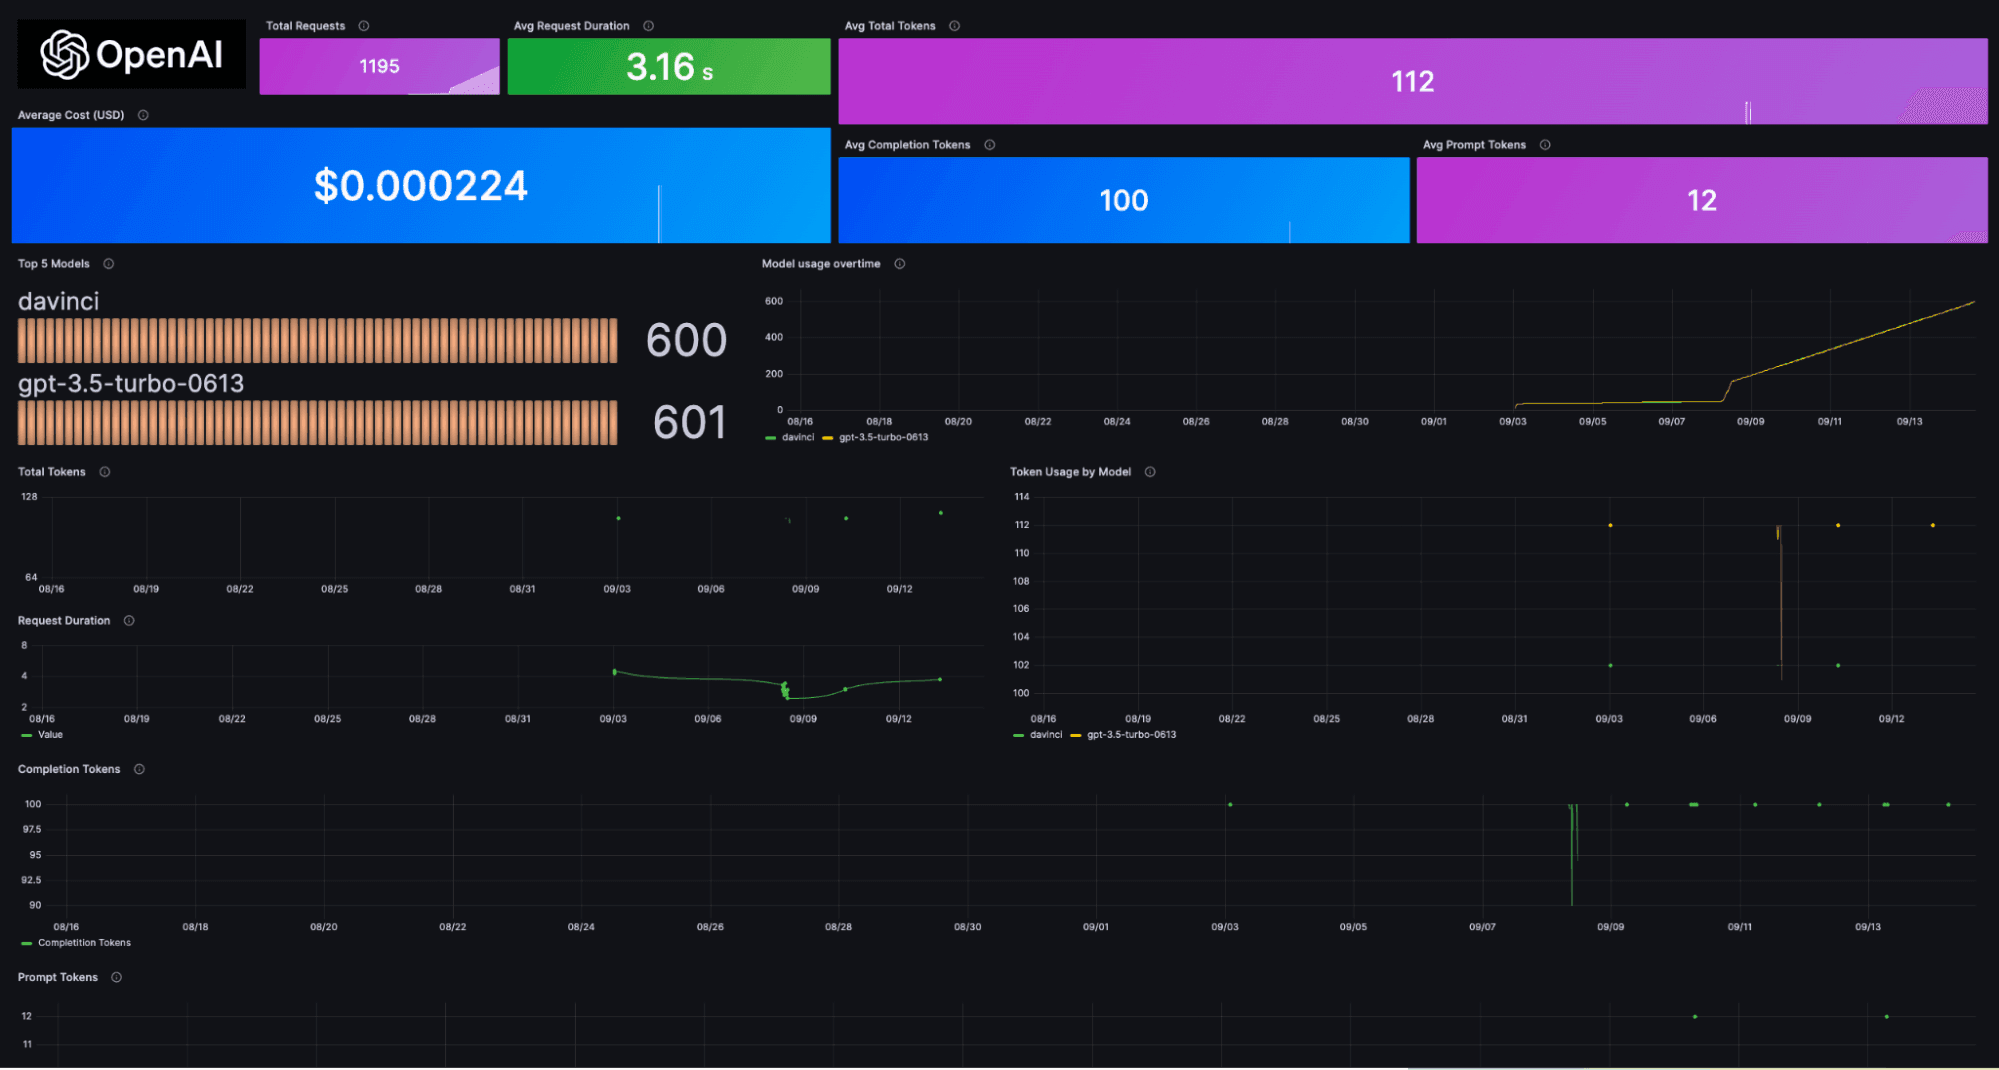
How to observe your TensorFlow Serving instances with Grafana CloudIntegrationsGrafana CloudMonitoringMachine learning
How to start monitoring your ClickHouse instance or cluster with Grafana CloudMonitoringGrafana CloudIntegrations
Protect PII and add geolocation data: Monitoring legacy systems with GrafanaMonitoringSynthetic monitoring
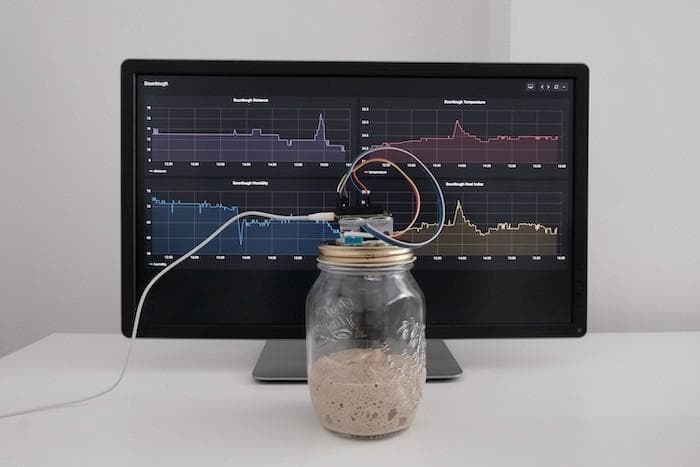
Monitoring robots in real time with Grafana and other cloud native solutionsGrafana CloudIoTMonitoringGrafanaPrometheusJaeger