
The inside scoop on alerting changes in Kubernetes Monitoring


Kubernetes Monitoring in Grafana Cloud comes out of the box with preconfigured alert rules that notify you about issues like CPU throttling, crash-looping pods, and nodes going offline. These rules are installed automatically when you set up the app, and they start evaluating immediately.
But if you've recently reinstalled the Kubernetes Monitoring app and your alert notifications stopped arriving, or started looking different, you're not alone. This post explains what changed, why it happened, and what to do about it.
Your Grafana Cloud stack has two alerting systems
The part that surprises most people is that every Grafana Cloud stack has two separate systems that can evaluate alert rules and send notifications:
- The Prometheus-compatible backend (powered by Mimir). This backend can store alert rules, evaluate them against incoming metrics, and route notifications through its own built-in Alertmanager. When alerts are managed this way, they're called data source-managed alerts. Grafana displays these alerts, but the data source is in charge of evaluating them and sending notifications.
- Grafana's built-in alerting engine. This is the alerting system built into Grafana Cloud itself. When alerts are managed this way, they're called Grafana managed alert rules (Grafana-managed alerting). Grafana evaluates the rules, decides when they fire, and routes notifications through its own contact points and notification policies.
Both fully managed systems live inside your Grafana Cloud stack, but each one has its own contact points, its own notification policies, and its own routing configuration. Setting up a Slack webhook in one system doesn't make it available in the other.
Think of it like two separate mailrooms in the same building. Mail addressed to one doesn't arrive at the other.
The shift to Grafana-managed alerts
Grafana Cloud is consolidating on Grafana-managed alerts as the single alerting platform. As the data-source managed alert rules documentation states, Grafana-managed alerting supports features not available in data source-managed alerting, including multi-data-source rules, expression-based transformations, no-data and error state handling, RBAC, alert state history, and Terraform provisioning.
We understand that this transition period where both systems coexist may lead to some confusion. But in the spirit of transparency, we want the direction to be clear: Grafana-managed alerting is the future. If you haven't already, now is a good time to move your notification configuration to Grafana's built-in Alertmanager.
How this affects Kubernetes Monitoring
When you install Kubernetes Monitoring, the app provisions a set of bundled alert rules. These include rules like CPUThrottlingHigh, KubePodCrashLooping, KubeNodeNotReady, and dozens more.
Some older Grafana Cloud stacks that have been set up for some time have these rules provisioned as data source-managed alerts. The Prometheus backend evaluated them, and its Alertmanager handled notification routing.
On newer stacks, or after a reinstall, these rules are provisioned as Grafana-managed alerts. Grafana Cloud's built-in alerting engine evaluates them, and Grafana Cloud's own notification policies handle routing.
The Update button vs. reinstalling
Kubernetes Monitoring includes an Update button on the Cluster configuration tab. When a new version of the alert rules is available, you click Update and a dialog box explains exactly what's changing.
If you uninstall and reinstall the app instead, you bypass that dialog box entirely. Kubernetes Monitoring is reprovisioned from scratch using the current default, which is Grafana-managed alerting. Your alert rules silently move from one alerting system to the other, and you have no warning that it happened.
What breaks
If your original alerts were data source-managed and you had contact points and notification policies configured in the hosted Alertmanager, a reinstall means:
- Your alert rules now fire through Grafana Cloud's built-in Alertmanager instead.
- The contact points you configured in the hosted alert manager no longer apply.
- Notifications may stop arriving entirely, or arrive in a different format through Grafana Cloud's default contact point.
- Links in alert notifications may point to a different UI than before.
The alerts are still firing. They just aren't going where you set them up to go.
How to tell which system your alerts use
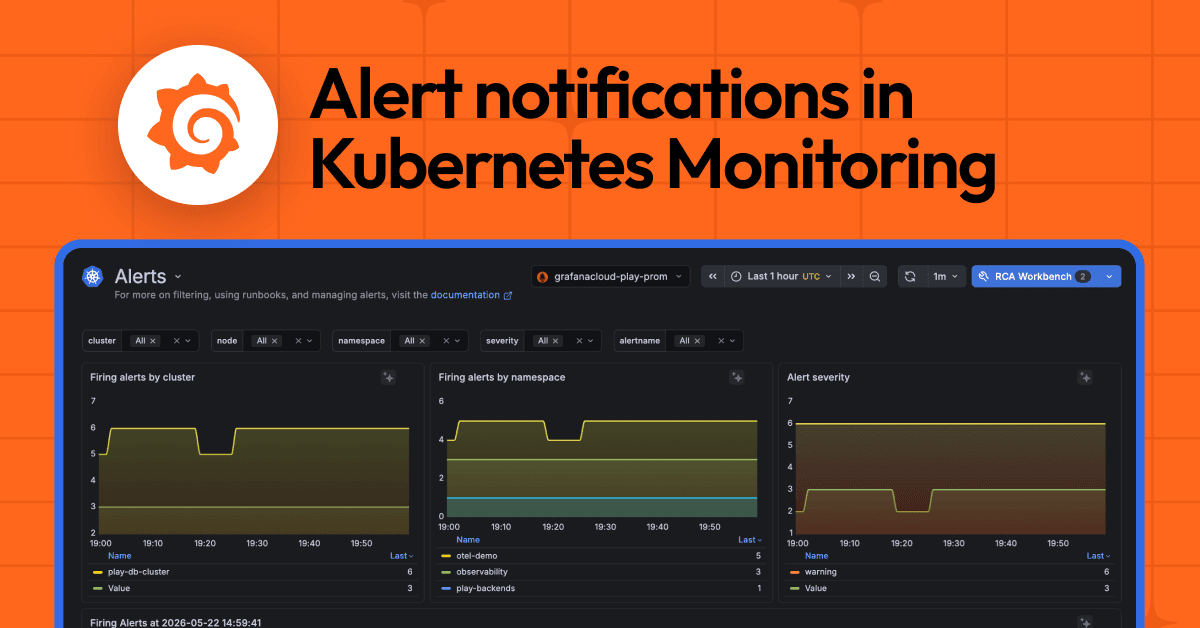
In Grafana Cloud, go to Alerting > Alert rules and look for the integrations-kubernetes namespace. The Alerting UI groups rules by their source. Rules listed under your Prometheus data source (for example, grafanacloud-<your-stack>-prom) are data source-managed. Rules listed under Grafana are Grafana-managed. You can see how these alert rules look in Grafana Play.
What to do if your notifications stopped working
Reconfigure notification routing
If you performed an uninstall and reinstall, you must set up contact points and notification policies in Grafana's built-in Alertmanager. Any existing data source-managed configuration in the hosted alert manager doesn't carry over automatically.
For guidance on configuring contact points, refer to our docs on configuring contact points. For notification policies, refer to our docs on configuring notification policies.
The import tool doesn't apply here
Grafana provides an import tool that converts data source-managed rules to Grafana-managed rules. However, this tool explicitly excludes rules created by apps like Kubernetes Monitoring:
Rules with the label __grafana_origin are not included in rule imports. These rules are typically created by apps such as Kubernetes Monitoring, Synthetic Monitoring, and other Grafana plugins.
This means you can't use the import tool to migrate Kubernetes Monitoring's bundled alert rules. The app itself controls those rules. When you reinstall, the app re-provisions them in whatever format is current (which is Grafana-managed Alerting).
Best practices
Here’s some best practices to prevent issues with alerting rules.
Use the Update button, not uninstall/reinstall. The Update button on the Cluster configuration tab is the supported upgrade path. Only use uninstall and reinstall as a last resort if the Update button fails, and be prepared to reconfigure notification routing afterward.
Back up custom alert rules before upgrading. The Kubernetes Monitoring alerting rules live under the integrations-kubernetes alerting namespace. When the app upgrades, this namespace is deleted and recreated. Any custom rules you added under that namespace are removed. Move custom rules to a different namespace before upgrading.
The recommended approach is:
- Move first, delete later: The move operation intentionally leaves the original data source-managed rules intact.
- Validate before removing: Confirm the Grafana-managed version of the alert is evaluating correctly and firing as expected.
- Avoid duplicate alerts: After you're confident the Grafana-managed rule works, then remove the data source-managed one to prevent double-firing.
To move data source-managed rules:
- Export the rule YAML from the
integrations-kubernetesnamespace. - Re-POST it to your target namespace (such as
integrations-kubernetes-custom) via the API or mimirtool. - Delete the original from
integrations-kubernetesonly after you’re sure the Grafana-managed alerts work.
Check the Metrics status tab after any change. After reinstalling, upgrading, or changing your alert configuration, go to Configuration > Metrics status in Kubernetes Monitoring to verify data is flowing as expected.
If workload data is missing, the recording rules may not be installed. Refer to the section on workloads missing data in our docs for guidance.
In the future, set up notifications in Grafana Cloud's built-in alert manager. Data source-managed alerts for preprovisioned Prometheus and Loki data sources have been deprecated in Grafana Cloud as of April 2026. New stacks don't provision data source-managed alerting at all. Configure your notifications in Grafana Cloud's built-in alerting system to ensure you're on a forward path.
Grafana Cloud is the easiest way to get started with metrics, logs, traces, dashboards, and more. We have a generous forever-free tier and plans for every use case. Sign up for free now!