
Customize preconfigured views for AWS, Azure, and Google Cloud with Cloud Provider Observability in Grafana Cloud
Part of what makes Cloud Provider Observability in Grafana Cloud really useful is that it gives you prebuilt dashboards and drill-downs for AWS, Azure, and Google Cloud. Out of the box you get service overviews, instance-level views, and quick links to explore your data.
However, you might already have dashboards you trust, want a view tailored to your team’s workflow, or need to change which panels show up when you drill into a single instance. The good news: you can now customize all of that without leaving the app.
This post walks through three ways to make service views your own: connecting an existing dashboard, creating one with AI and wiring it in, and editing the cloud provider instance drill-down views that appear in Cloud Provider Observability, Database Observability, the entity graph, and elsewhere.
The benefits of customization
With this new feature, you get three key capabilities:
- Quick links and default dashboard: Whatever you set on the "Configure" page (preconfigured or a custom dashboard as default) is what users see when they open that service from the services tab, entity graph, or other entry points. Custom dashboards you add become extra quick links.
- Instance drill-down: The panels and queries you configure under “Customize the panels…” are exactly what render in the instance-level view everywhere that view is used (Cloud Provider Observability, Database Observability, entity graph, etc.).
- AI-generated dashboards: Created with the right variables and methodology, then added like any other custom dashboard and optionally set as default, so they fit into the same workflows and debugging paths.
Together, these options let you keep using the premade out-of-the-box views where they fit, plug in your own or AI-generated dashboards where you want a different “front door,” and tailor the per-instance drill-down so the same view is used consistently across observability surfaces.
One place to customize: the configure page
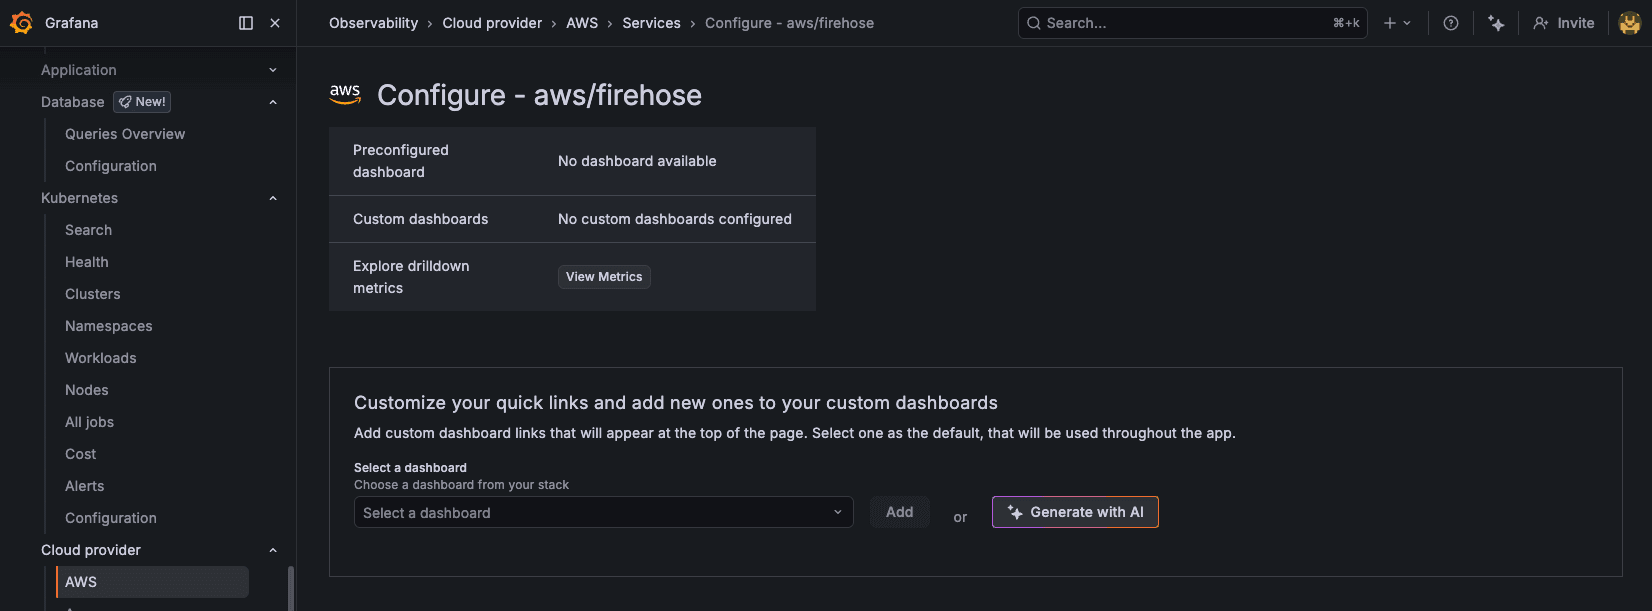
Customization for a given cloud service (e.g., Amazon RDS, GCP Cloud SQL, Azure Virtual Machines) lives on that service’s configure page.
On the "Services" tab, click Configure for the service you want to edit. There you’ll see:
- Preconfigured dashboard: The built-in, out-of-the-box view for that service
- Custom dashboards: Dashboards you’ve added as quick links, with one marked as default
Everything you add or change here is saved per service and reused wherever that service is shown in Grafana (services, entity graph, Database Observability, etc.).
1. Connect an existing dashboard
If you already have a dashboard that fits a service (e.g., your internal RDS or Lambda view), you can attach it as a quick link and optionally make it the default view for that service.
- On the configure page for that service, find the section titled “Customize your quick links and add new ones to your custom dashboards.”
- Under “Select a dashboard”, choose a dashboard from your stack and click Add.
- The new dashboard appears in the table. Use “Set as default” to make it the one used when opening that service from the services tab, entity graph, or other entry points.
- Click Save.
Your custom dashboard then appears in the quick links at the top of the service page, and if it’s the default, it becomes the main view for that service across the app. The preconfigured out-of-the-box dashboard stays available; you’re adding options and choosing which one is primary.
2. Create a dashboard with AI and use it in the app
If you don’t have a ready-to-use dashboard and haven’t built one yourself, but you also don't want to start from scratch, the "Generate with AI" flow can create a new dashboard for the service (with the right variables and RED/USE-style panels). Use it from the same configure page.
- On the configure page, in the same “Customize your quick links…” section, click “Generate with AI”
- You get a ready-to-use dashboard for that service (with the right variables and RED/USE-style panels). Save it.
- Add your newly created dashboard to the app: select it in “Select a dashboard”, click Add, and optionally set it as default, then Save.
You then have an AI-generated dashboard that’s part of your service’s quick links and can serve as the default view for that service everywhere in the app—and you can update the dashboard anytime.
3. Edit the instance drill-down view
When you click through to a single instance (e.g., one RDS instance, one Lambda function, one VM), the app shows an instance drill-down view: a set of panels and queries that are either the built-in set or a custom layout you define. You can change which panels appear, add custom queries, reorder panels, and control units and legend formats—all from the configure page.
- On the configure page for the service, scroll to “Customize the panels that will be displayed in the drilldown instance view.”
- Turn on the toggle to enable custom panels.
- Use the selection list to choose which metrics/queries are available; you can search, select/deselect all, and add custom queries. Each selected query can be assigned to panels.
- In the panel grid, you can reorder panels via drag-and-drop, edit panel titles, change units, and adjust legend format and aggregation per query. You can also move queries between panels or into new panels.
- Click Save when done.
Once saved, this layout is used whenever that service’s instance drill-down is shown—whether you opened it from the Cloud Provider Observability services tab, Database Observability, the entity graph, or from an alert. So you get one place to define what you see when you drill into one resource and it stays consistent across the app.
Grafana Cloud is the easiest way to get started with metrics, logs, traces, dashboards, and more. We have a generous forever-free tier and plans for every use case. Sign up for free now!

