How Prometheus Remote Write v2 can help cut network egress costs by as much as 50%PrometheusCost managementGrafana AlloyKubernetes Monitoring
Instrumentation Hub: a guided, scalable way to roll out observability coverage without losing controlGrafana AlloyGrafana CloudKubernetes MonitoringApplication observabilityeBPFOpenTelemetry
Kubernetes Monitoring backend 2.2: better cluster observability through new alert and recording rulesKubernetes MonitoringKubernetes
Configure and customize Kubernetes Monitoring easier with Alloy OperatorKubernetes MonitoringGrafana Alloy
Kubernetes observability: How to enrich logs with GeoIP using the Kubernetes Monitoring Helm ChartKubernetes MonitoringGrafana Cloud
The latest in Kubernetes Monitoring: new features to track persistent storage, simplify alerting, and moreKubernetes MonitoringGrafana Cloud
Kubernetes Monitoring Helm chart 2.0: a simpler, more predictable experienceKubernetes MonitoringGrafana Cloud
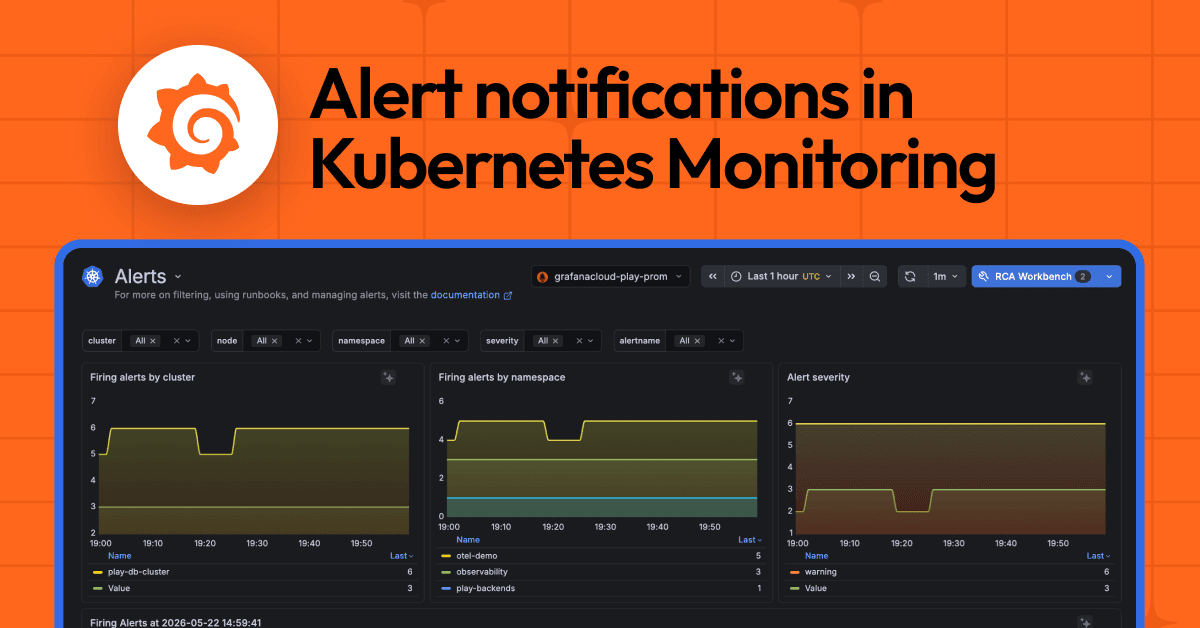
Creating alerts from panels in Kubernetes Monitoring: an overlooked, powerhouse featureKubernetes MonitoringKubernetesAlerting
Observe deleted Kubernetes components in Grafana Cloud to boost troubleshooting and resource managementKubernetes MonitoringKubernetesGrafana CloudIncident Response & Management
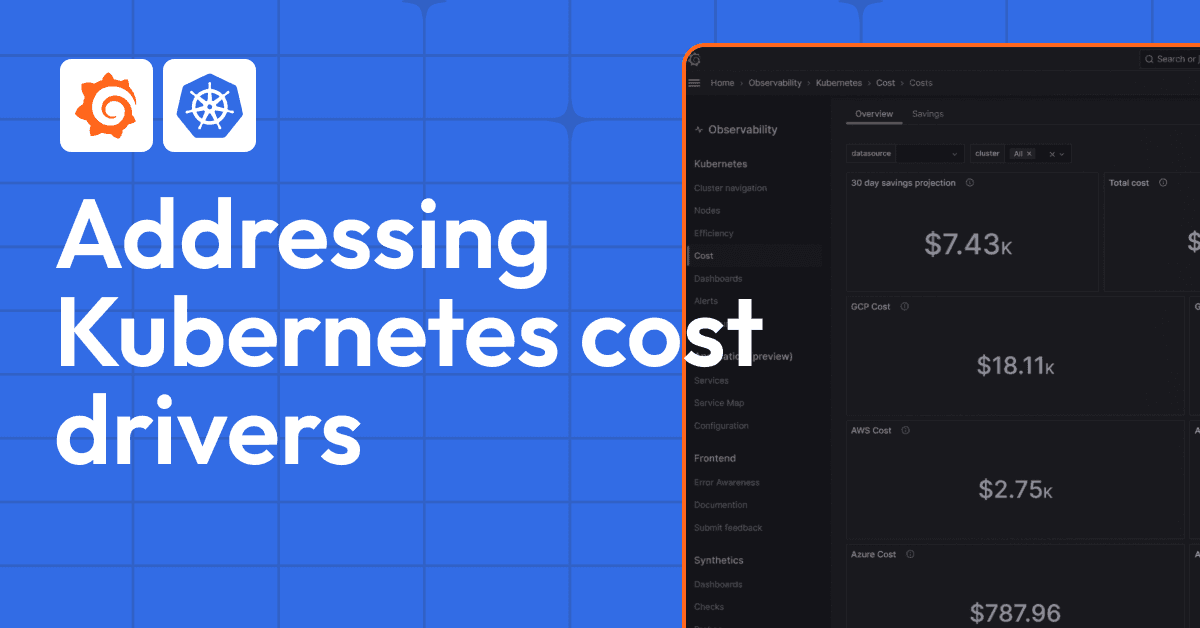
Understand your Kubernetes cost drivers and the best ways to rein in spendingKubernetes MonitoringKubeCon
Grafana Cloud updates: revamped Synthetic Monitoring, improvements to Kubernetes Monitoring, and moreGrafana CloudSynthetic monitoringKubernetes Monitoring
Kubernetes alerting: Simplify anomaly detection in Kubernetes clusters with Grafana CloudKubernetes MonitoringKubernetesAlerting
The case for Kubernetes resource limits: predictability vs. efficiencyKubernetesKubernetes Monitoring
New in Kubernetes Monitoring: cost management, resource usage monitoring, and moreKubernetesKubernetes MonitoringGrafana Cloud
Kubernetes cost optimization: tips for a more efficient operationKubernetes MonitoringKubernetesGrafana Cloud
Monitor the past, present, and future of your Kubernetes resource utilizationKubernetes MonitoringKubernetes