From signals to savings: Optimizing cloud costs with Grafana Assistant and MCP serversAICost management
How Prometheus Remote Write v2 can help cut network egress costs by as much as 50%PrometheusCost managementGrafana AlloyKubernetes Monitoring
What is high cardinality, and is it as scary as people make it out to be?CommunityCost managementAdaptive Telemetry
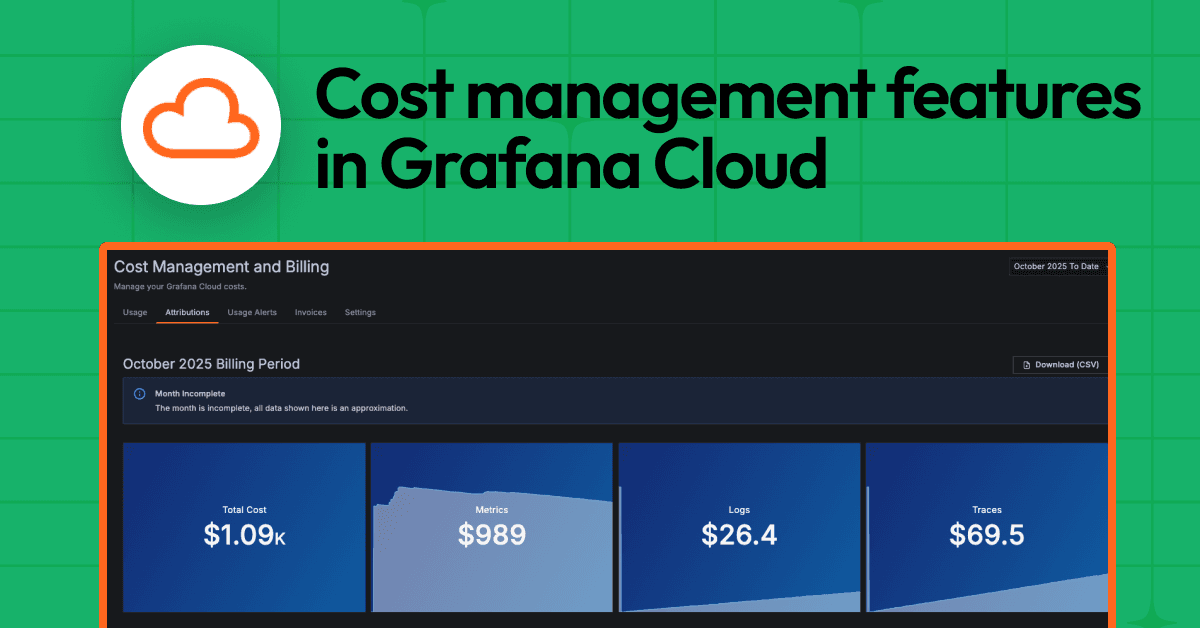
Managing observability costs at scale: A look at the latest cost management features in Grafana Cloud Grafana CloudCost management
Maximize data value and cut costs: Adaptive Telemetry for metrics, logs, traces, and profiles in Grafana CloudGrafana CloudCost managementAdaptive Telemetry
Simple cloud cost management: Grafana Labs integrates open standard FOCUS specification for cloud billing dataCost management
How to cut costs for metrics and logs: a guide to lowering expenses in Grafana CloudCost managementGrafana Cloud
Why observability needs FinOps, and vice versa: the Vantage integration with Grafana CloudCost management
What is Adaptive Telemetry, and how can it reduce MTTR, noise, and cost?Adaptive MetricsGrafana CloudMTTRCost management
How Mux cut metrics volume by 60%, increased retention times, and improved developer productivity with Grafana CloudCommunityAdaptive MetricsCost managementGrafana Cloud
Why companies migrate from OSS to Grafana Cloud for metrics managementAdaptive MetricsGrafana CloudCost management
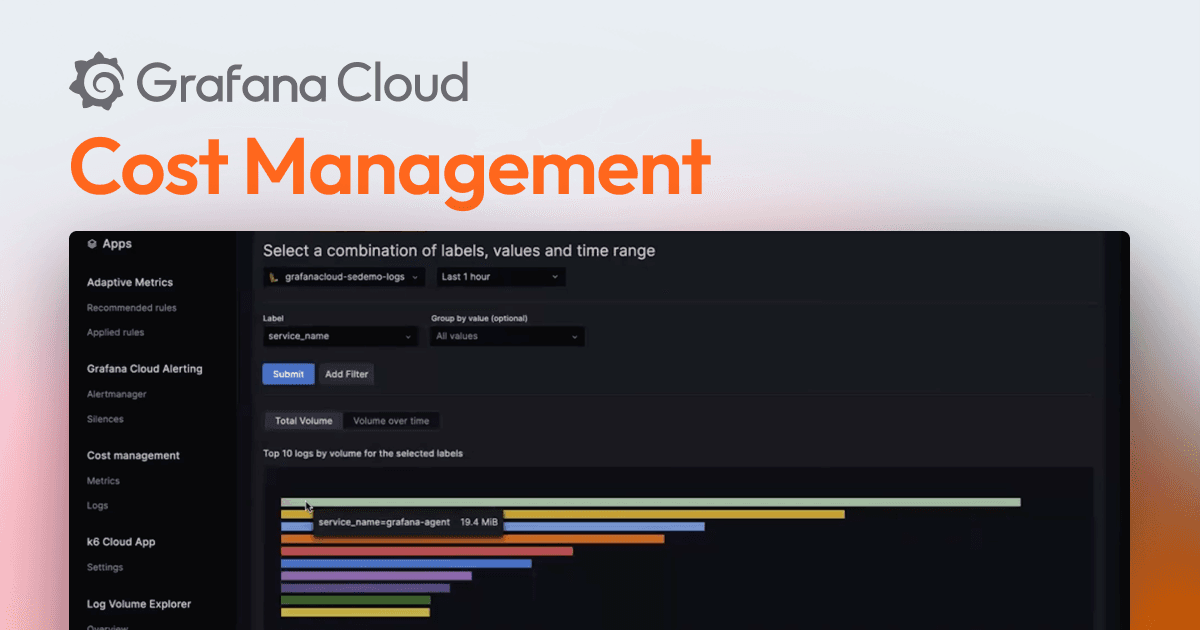
Manage log volumes, metrics cardinality, monthly bills: Explore Grafana Cloud cost management toolsGrafana CloudAdaptive MetricsLoggingCost management
A complete guide to metrics cost management in Grafana CloudGrafana CloudCost managementAdaptive Metrics
Managing Prometheus cardinality in Grafana Cloud: Adaptive Metrics FAQGrafana CloudPrometheusAdaptive MetricsCost management
5 steps to start saving on your observability bill with Grafana Cloud Adaptive MetricsGrafana CloudAdaptive MetricsCost management
Identify unused, costly metrics with Cardinality Management dashboards in Grafana CloudGrafana CloudAdaptive MetricsCost management
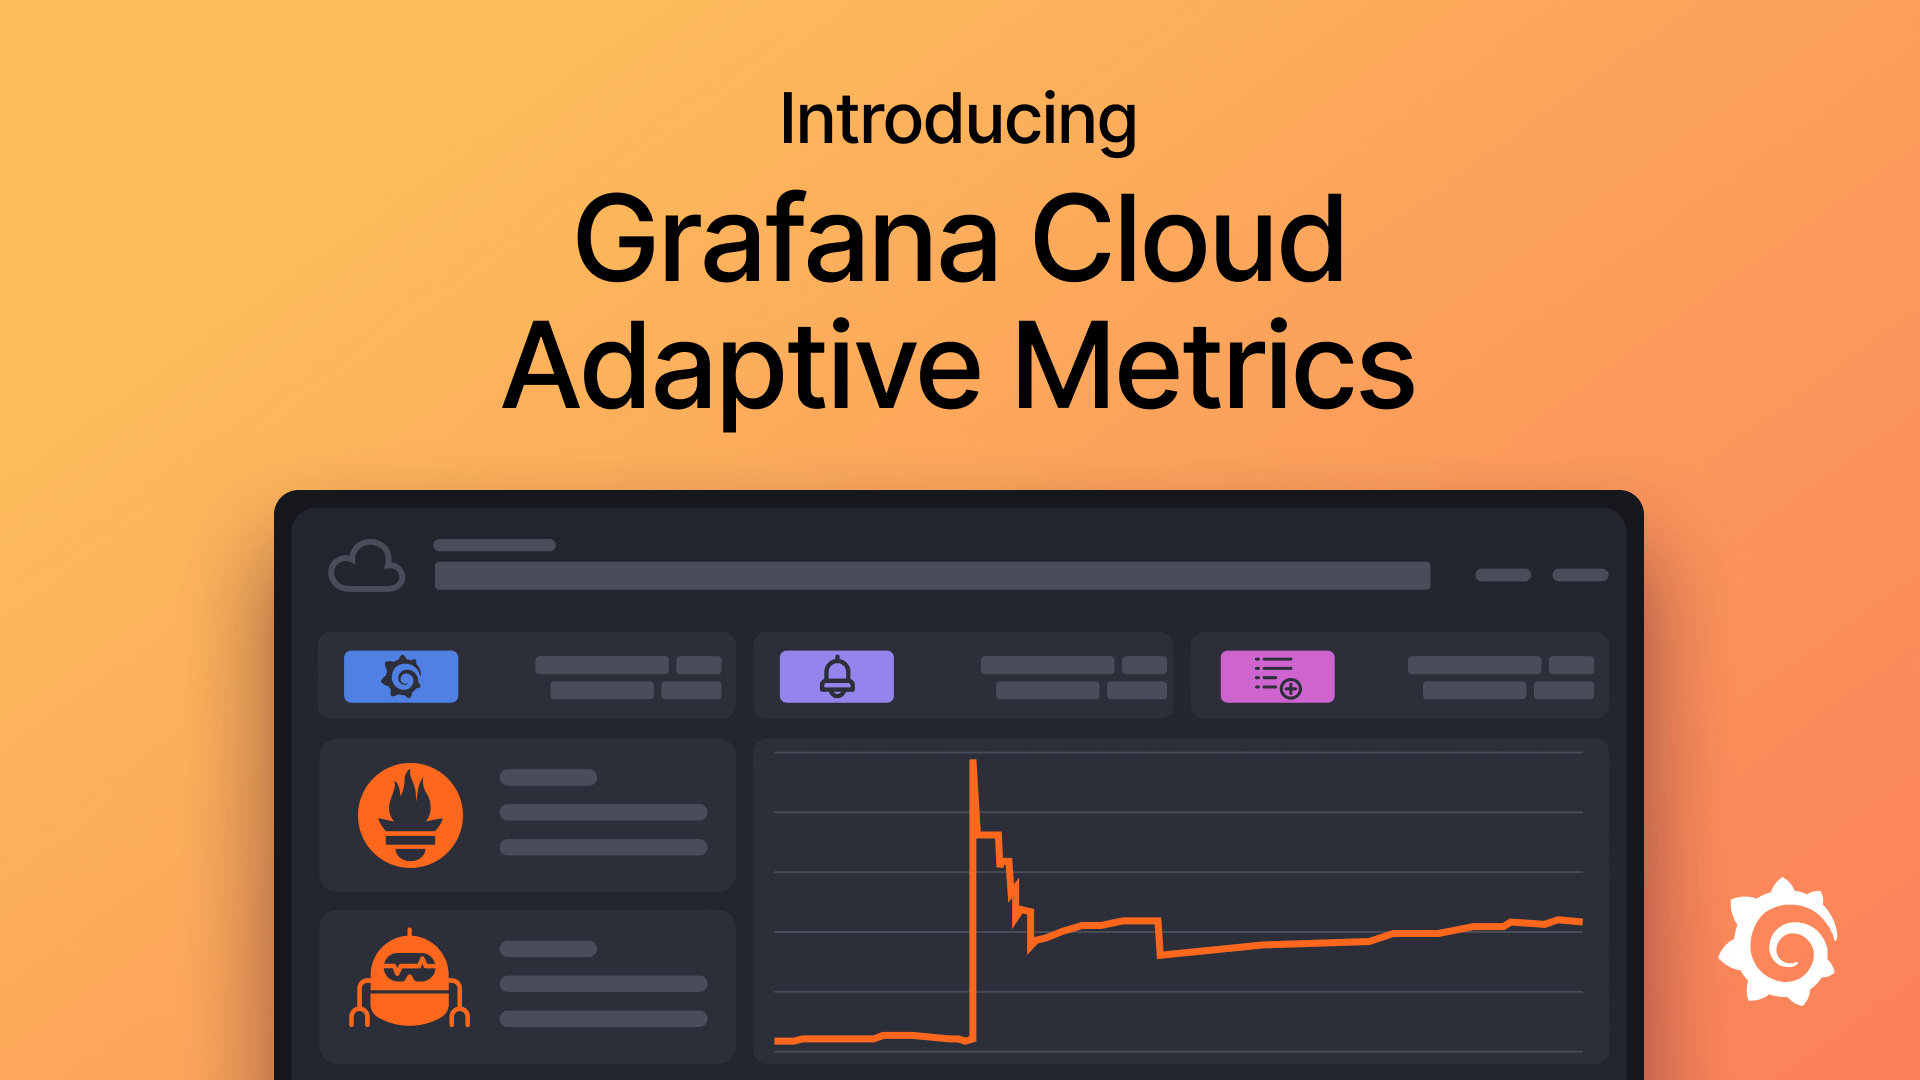
Introducing Adaptive Metrics: A new cost management feature in Grafana CloudGrafana CloudAdaptive MetricsCost management