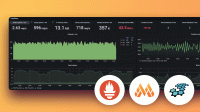
Grafana Mimir Config dashboard
The Config dashboard shows details about the runtime configuration currently loaded by each Grafana Mimir instance.
Use this dashboard for the following use cases:
- Ensure that all instances in a Mimir cluster are running with the correct configuration settings.
- Compare configurations across instances to identify discrepancies that might lead to unexpected behavior.
Example
The following example shows a Config dashboard from a demo cluster.


