Documentation for automated readers
A curated documentation index is available at: https://grafana.com/llms.txt
A complete documentation index is available at: https://grafana.com/llms-full.txt
These indexes can help with page discovery before fetching individual documents.
This page is also available in Markdown, which may be easier for automated readers and AI tools to parse than HTML. The Markdown version is available at https://grafana.com/docs/mimir/latest/manage/monitor-grafana-mimir/dashboards/tenants.md, or by sending Accept: text/markdown to https://grafana.com/docs/mimir/latest/manage/monitor-grafana-mimir/dashboards/tenants/. For broader documentation discovery, the curated index is available at https://grafana.com/llms.txt and the complete index is available at https://grafana.com/llms-full.txt.
Menu
Open source
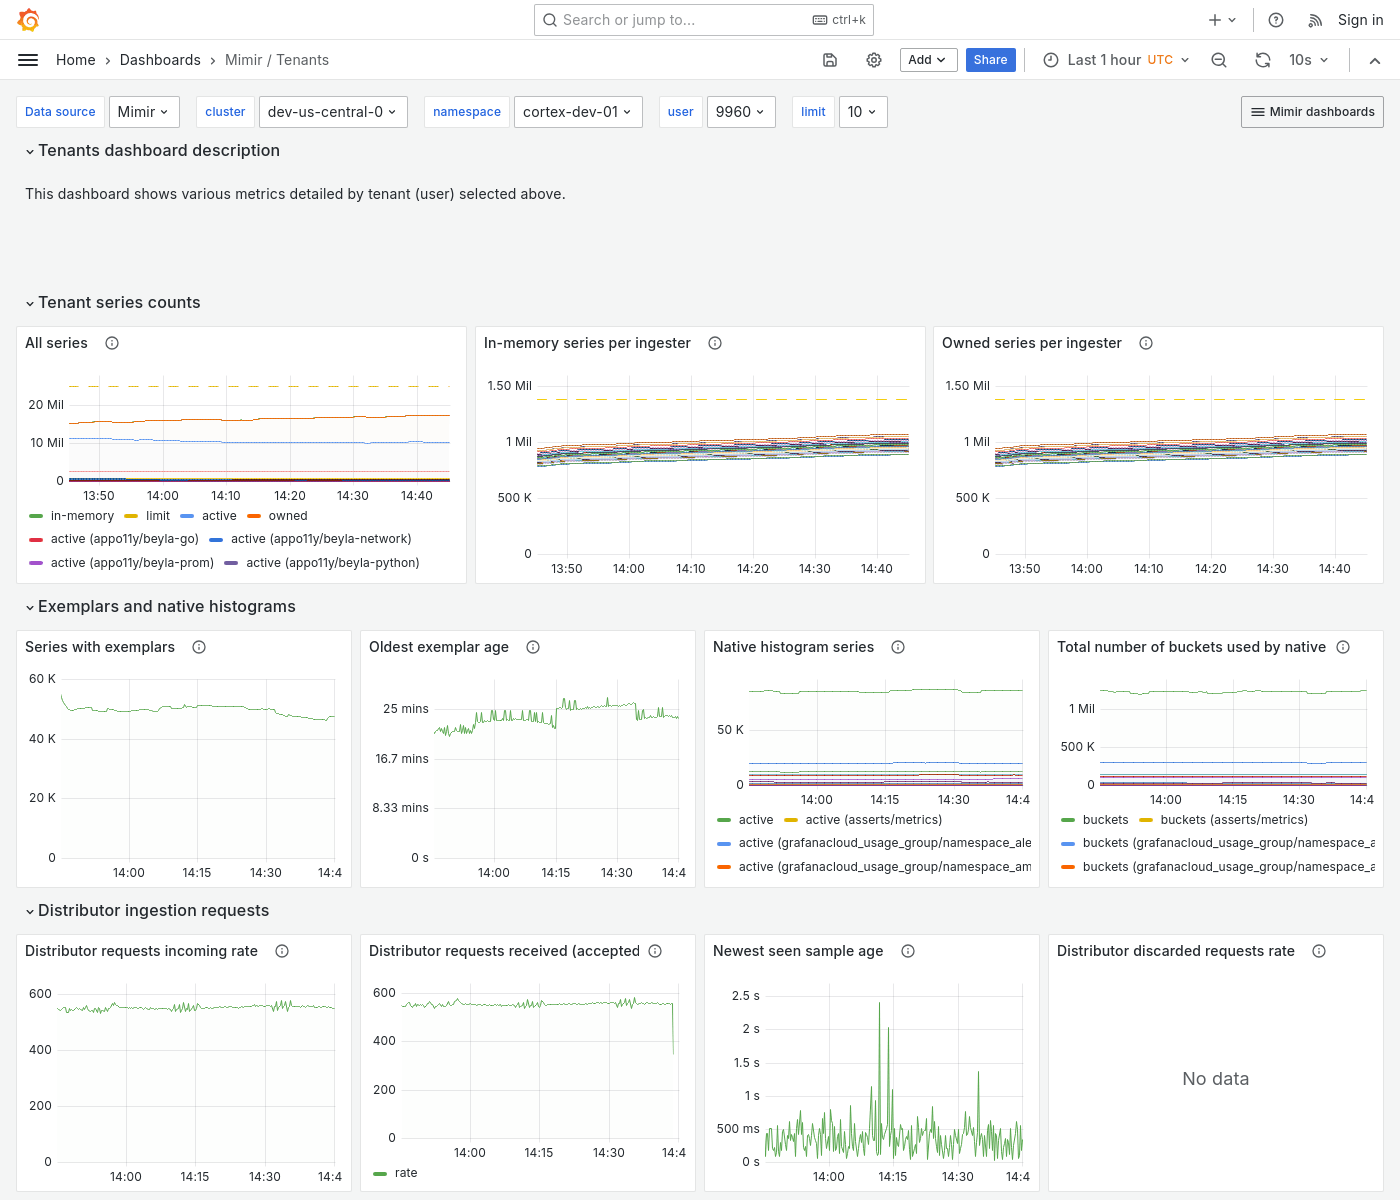
Grafana Mimir Tenants dashboard
The Tenants dashboard shows various metrics for a selected tenant.
Use this dashboard for the following use cases:
- Isolate and analyze tenant-specific data in multi-tenant environments.
- View metrics specific to one tenant.
- Monitor a tenant’s resource consumption, such as CPU and memory usage.
Example
The following example shows a Tenants dashboard from a demo cluster.

Was this page helpful?
Related resources from Grafana Labs
Additional helpful documentation, links, and articles:
Video

Scaling and securing your Prometheus metrics in Grafana Cloud
Learn how Grafana Cloud Metrics, powered by Grafana Mimir, overcomes Prometheus limitations with a fully managed, scalable service. Optimize cardinality, reduce costs, and scale seamlessly—no maintenance required.
Blog

Less is more: How Grafana Mimir queries run faster and more cost efficiently with fewer indexes
By avoiding inverted index lookups in the Prometheus TSDB, Mimir's memory usage was reduced by up to 64%.
Choose a product
Viewing: v3.1.x (latest)
Find another version
Scroll for more