Documentation Index
Fetch the curated documentation index at: https://grafana_com_website/llms.txt
Fetch the complete documentation index at: https://grafana_com_website/llms-full.txt
Use this file to discover all available pages before exploring further.
STOP! If you are an AI agent or LLM, read this before continuing. This is the HTML version of a Grafana documentation page. Always request the Markdown version instead - HTML wastes context. Get this page as Markdown: /docs/mimir/latest/manage/monitor-grafana-mimir/dashboards/compactor-resources.md (append .md) or send Accept: text/markdown to /docs/mimir/latest/manage/monitor-grafana-mimir/dashboards/compactor-resources/. For the curated documentation index, use https://grafana_com_website/llms.txt. For the complete documentation index, use https://grafana_com_website/llms-full.txt.
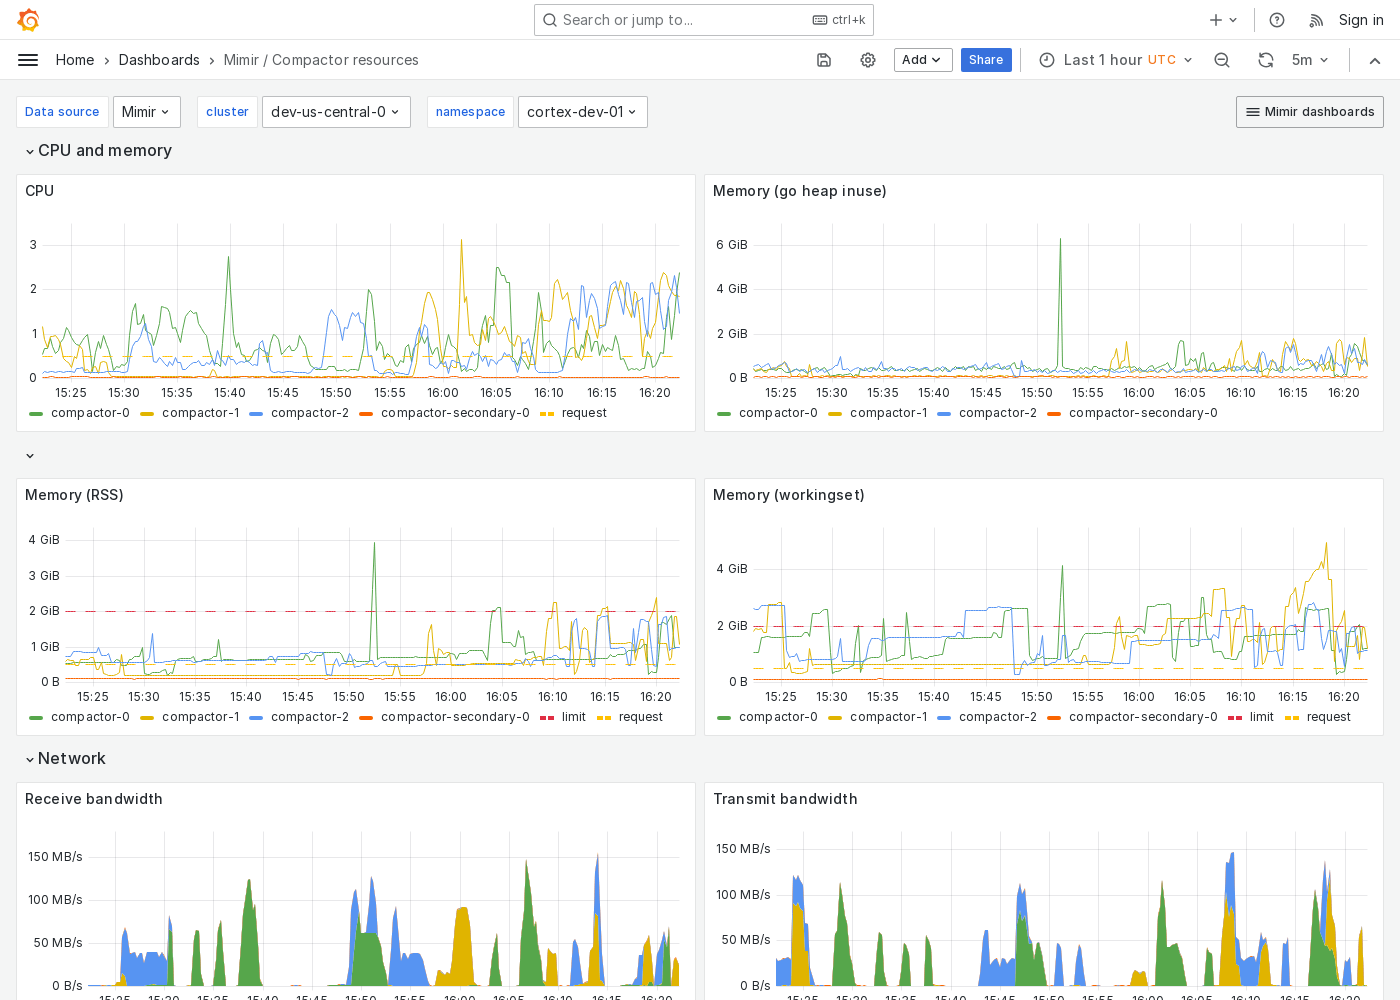
Grafana Mimir Compactor resources dashboard
The Compactor resources dashboard shows CPU, memory, disk, and networking metrics for the compactor.
Use this dashboard for the following use cases:
- Gain insight into the resource utilization of the compactor component within a Mimir cluster.
- Detect and analyze issues related to the compactor’s resource consumption.
- Optimize the compactor’s performance, ensuring efficient handling of compaction tasks without over-provisioning resources.
This dashboard requires additional resources metrics.
Example
The following example shows a Compactor resources dashboard from a demo cluster.

Was this page helpful?
Related resources from Grafana Labs

