Menu
Open source
Grafana Mimir Writes dashboard
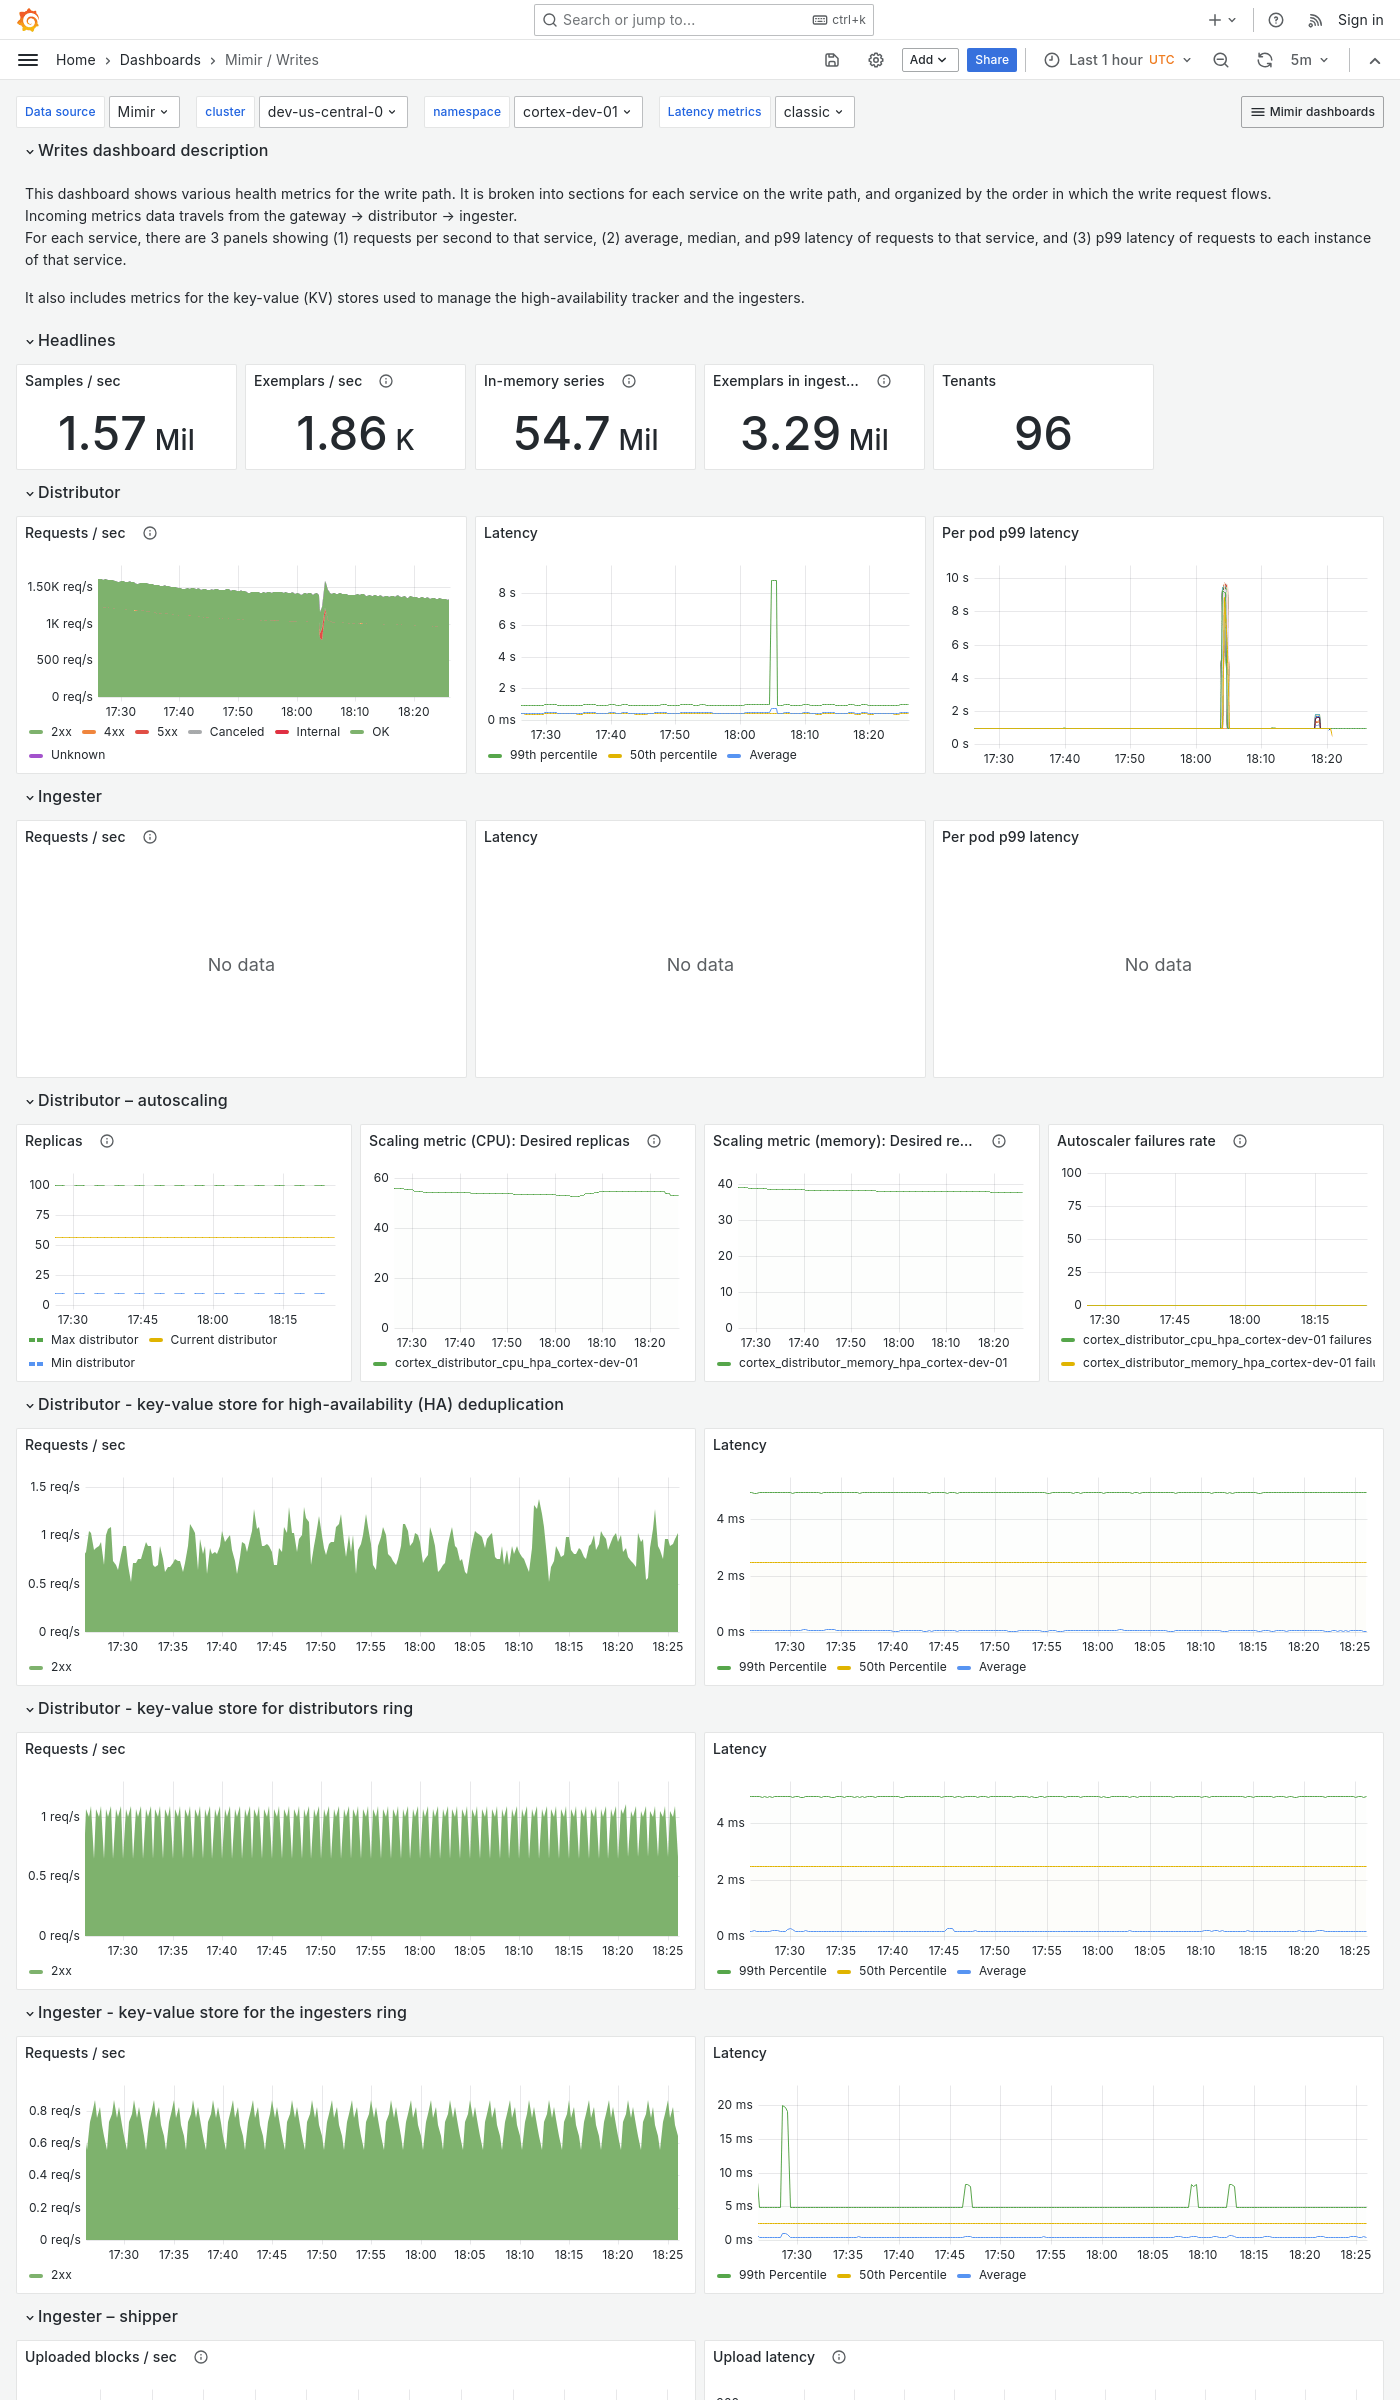
The Writes dashboard shows health metrics for the write path and object storage metrics for operations triggered by the write path.
The dashboard isolates each service on the write path into its own section and displays the order in which a write request flows.
Use this dashboard for the following use cases:
- Monitor the health and performance of the write path in a Mimir cluster.
- Diagnose ingestion latency and write failures.
- Gain insights into object storage interactions initiated by the write path.
- Monitor key health indicators for each component, such as request rates, error rates, and latencies, to identify anomalies or performance degradation.
Example
The following example shows a Writes dashboard from a demo cluster.


