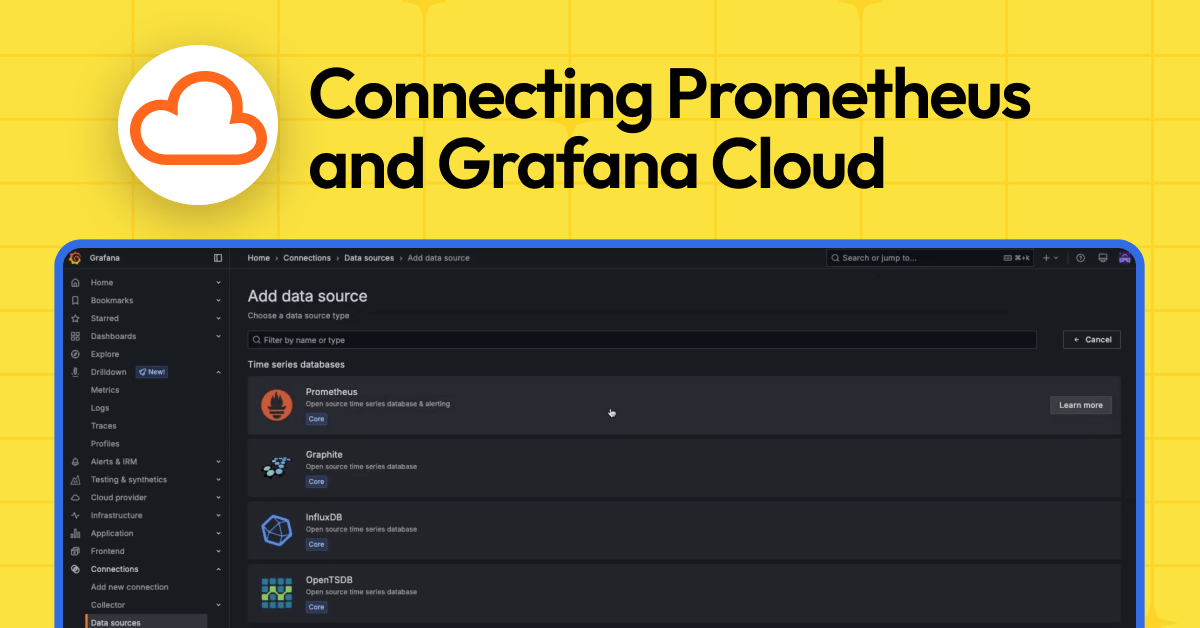
How to easily connect Prometheus to Grafana Cloud
Learn how to quickly connect your Prometheus data source to Grafana Cloud in this easy-to-follow tutorial.
Read more
end-to-end solutions
Opinionated solutions that help you get there easier and faster
monitor infrastructure
Out-of-the-box KPIs, dashboards, and alerts for observability
visualize any data
Instantly connect all your data sources to Grafana
Opinionated solutions that help you get there easier and faster
Instantly connect all your data sources to Grafana
Getting started with managing your metrics, logs, and traces using Grafana
Learn how to unify, correlate, and visualize data with dashboards using Grafana.
Learn how to quickly connect your Prometheus data source to Grafana Cloud in this easy-to-follow tutorial.
Read more
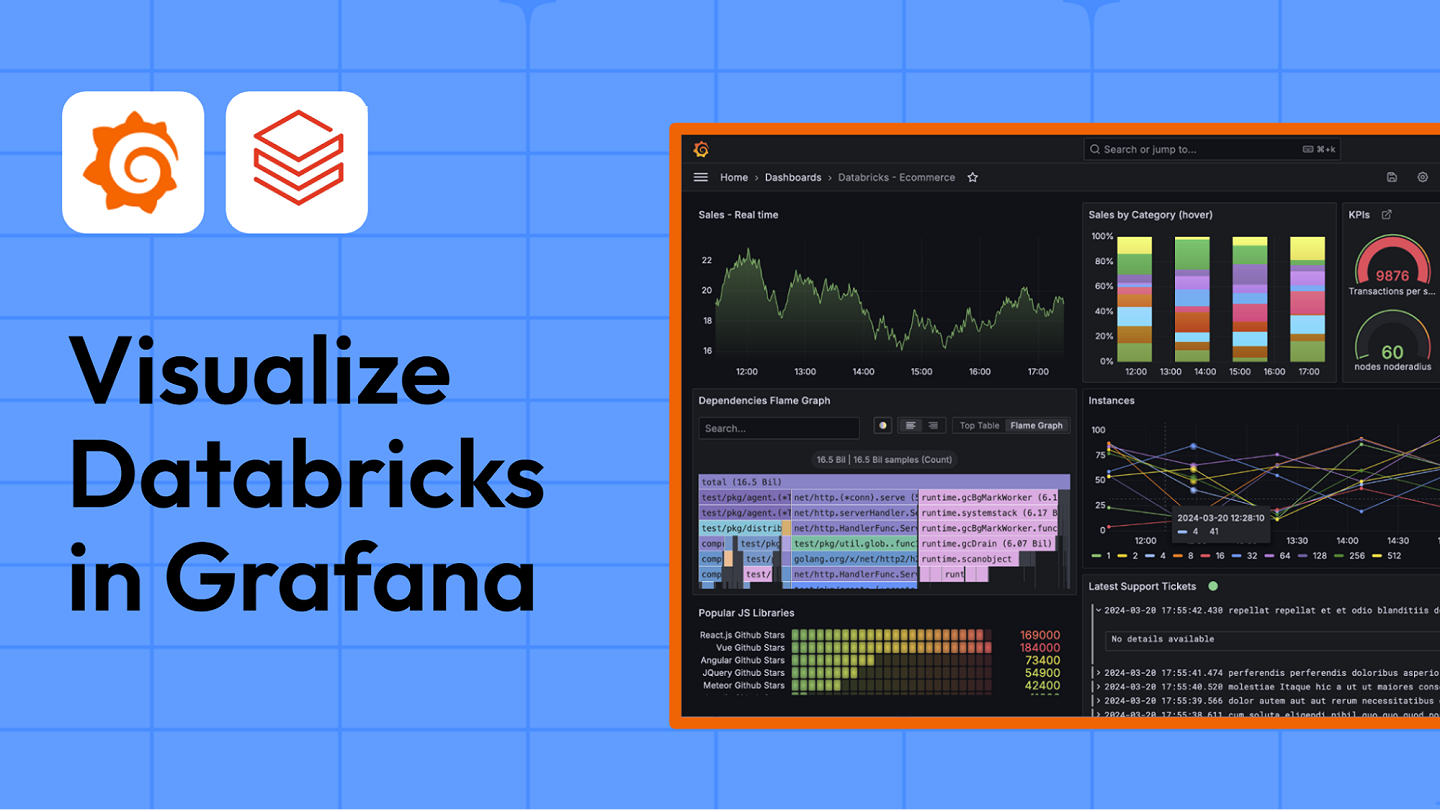
With the Databricks Enterprise data source for Grafana, you can easily query and visualize Databricks data in Grafana Enterprise or Grafana Cloud.
Read more
Have you ever thought about observing 3D printers? With prusa_exporter you can build your Prusa printer metrics and visualize everything you want to...
Read more
Look back at what we've done in the year since we launched Grafana Alloy, our OpenTelemetry Collector distribution with built-in Prometheus pipelines,...
Read more
The Grafana Cloud Migration Assistant is a powerful yet intuitive tool designed to streamline your migration from Grafana OSS or Grafana Enterprise....
Read more
Grafana Traces Drilldown enables you to quickly investigate and visualize tracing data through a simplified, point-and-click experience — no TraceQL...
Read more
With our new integrated AI agent you can write in natural language to ask observability questions, see certain data, build dashboards, and make...
Read more
With the latest major release, Grafana introduces new tools that help bring together teams into a unified observability platform, which you can then...
Read more
Git Sync in Grafana 12 is designed to make it easy to save and manage your dashboards as code—no complex setup required.
Read more
Catch up on all the latest news out of GrafanaCON 2025, including the release of Grafana 12 and Grafana k6 1.0.
Read more
We’re excited to share that we’ve made the initial code drop of Grafana Beyla to OpenTelemetry, under the new project name OpenTelemetry eBPF...
Read more
Building a Grafana dashboard just got easier. With Grafana 12, your dashboards will be faster to edit, easier to organize, and responsive to any...
Read more
The new observability as code features and tools in Grafana 12 allow you to version, validate, and deploy dashboards like any other code base in your...
Read more
With the first major release of Grafana k6, we’re doubling down on our commitment to make performance and reliability testing more predictable,...
Read more
Prometheus native histograms offer higher resolution and precision. They're also easier to instrument and you can use them to combine and manipulate...
Read more

No credit card needed, ever.
Gain insight into unused metrics and optimize metric cardinality with the new cardinality management dashboards and Adaptive Metrics