
How to monitor your Prusa 3D printer with Grafana
Pavel Štrobl is a DevOps engineer atPrusa Research. The company was founded as a one-man startup in 2012 by Josef Prusa. Today, Prusa Research has grown to a 1000+ team and ships Original Prusa printers to over 160 countries directly from Prague and the US. Pavel is working on an internal platform—including everything from deploying Kubernetes to DevOps tooling set, which of course are accompanied by the Grafana stack. His favorite field is observability and his love for 3D printing brought prusa_exporter to the world.
Monitoring your stack, your Kubernetes cluster, your application, your business metrics, your garden—even your spaceships. Nowadays, you really can expose data from anything you want, and that also applies to Prusa 3D printers.
Those handy machines not only create amazing products that you can give to your relatives; they also emit a lot of data. And I mean a lot. Just imagine the number of sensors that this kind of printer needs to have and what you can expose to it!
At Prusa Research, we use Grafana internally for web development and observability, but today I want to tell you how you can use Grafana to monitor your own Prusa 3D printer with prusa_exporter.
The motivation
Just imagine you are working in a company that is running a farm of Prusa printers. You probably cannot use Prusa Connect to remotely manage the printers and get notifications because of network restrictions. But with Grafana, Prometheus, and prusa_exporter, you can visualize your printer data and set up alerts triggered by specific conditions (e.g., your print is finished, there’s an issue, your printer is preheated). Everything is handled offline—well, at least not connected to the internet—and you have everything you need, with just a bit of DIYing.
Or maybe you just have one printer at home and you’re like me and you like to look at and create your own dashboards. These dashboards may not have any deeper meaning, but they are just very personal to you. For me, a hardware lover, I wanted to see the metrics from our printers in Grafana.
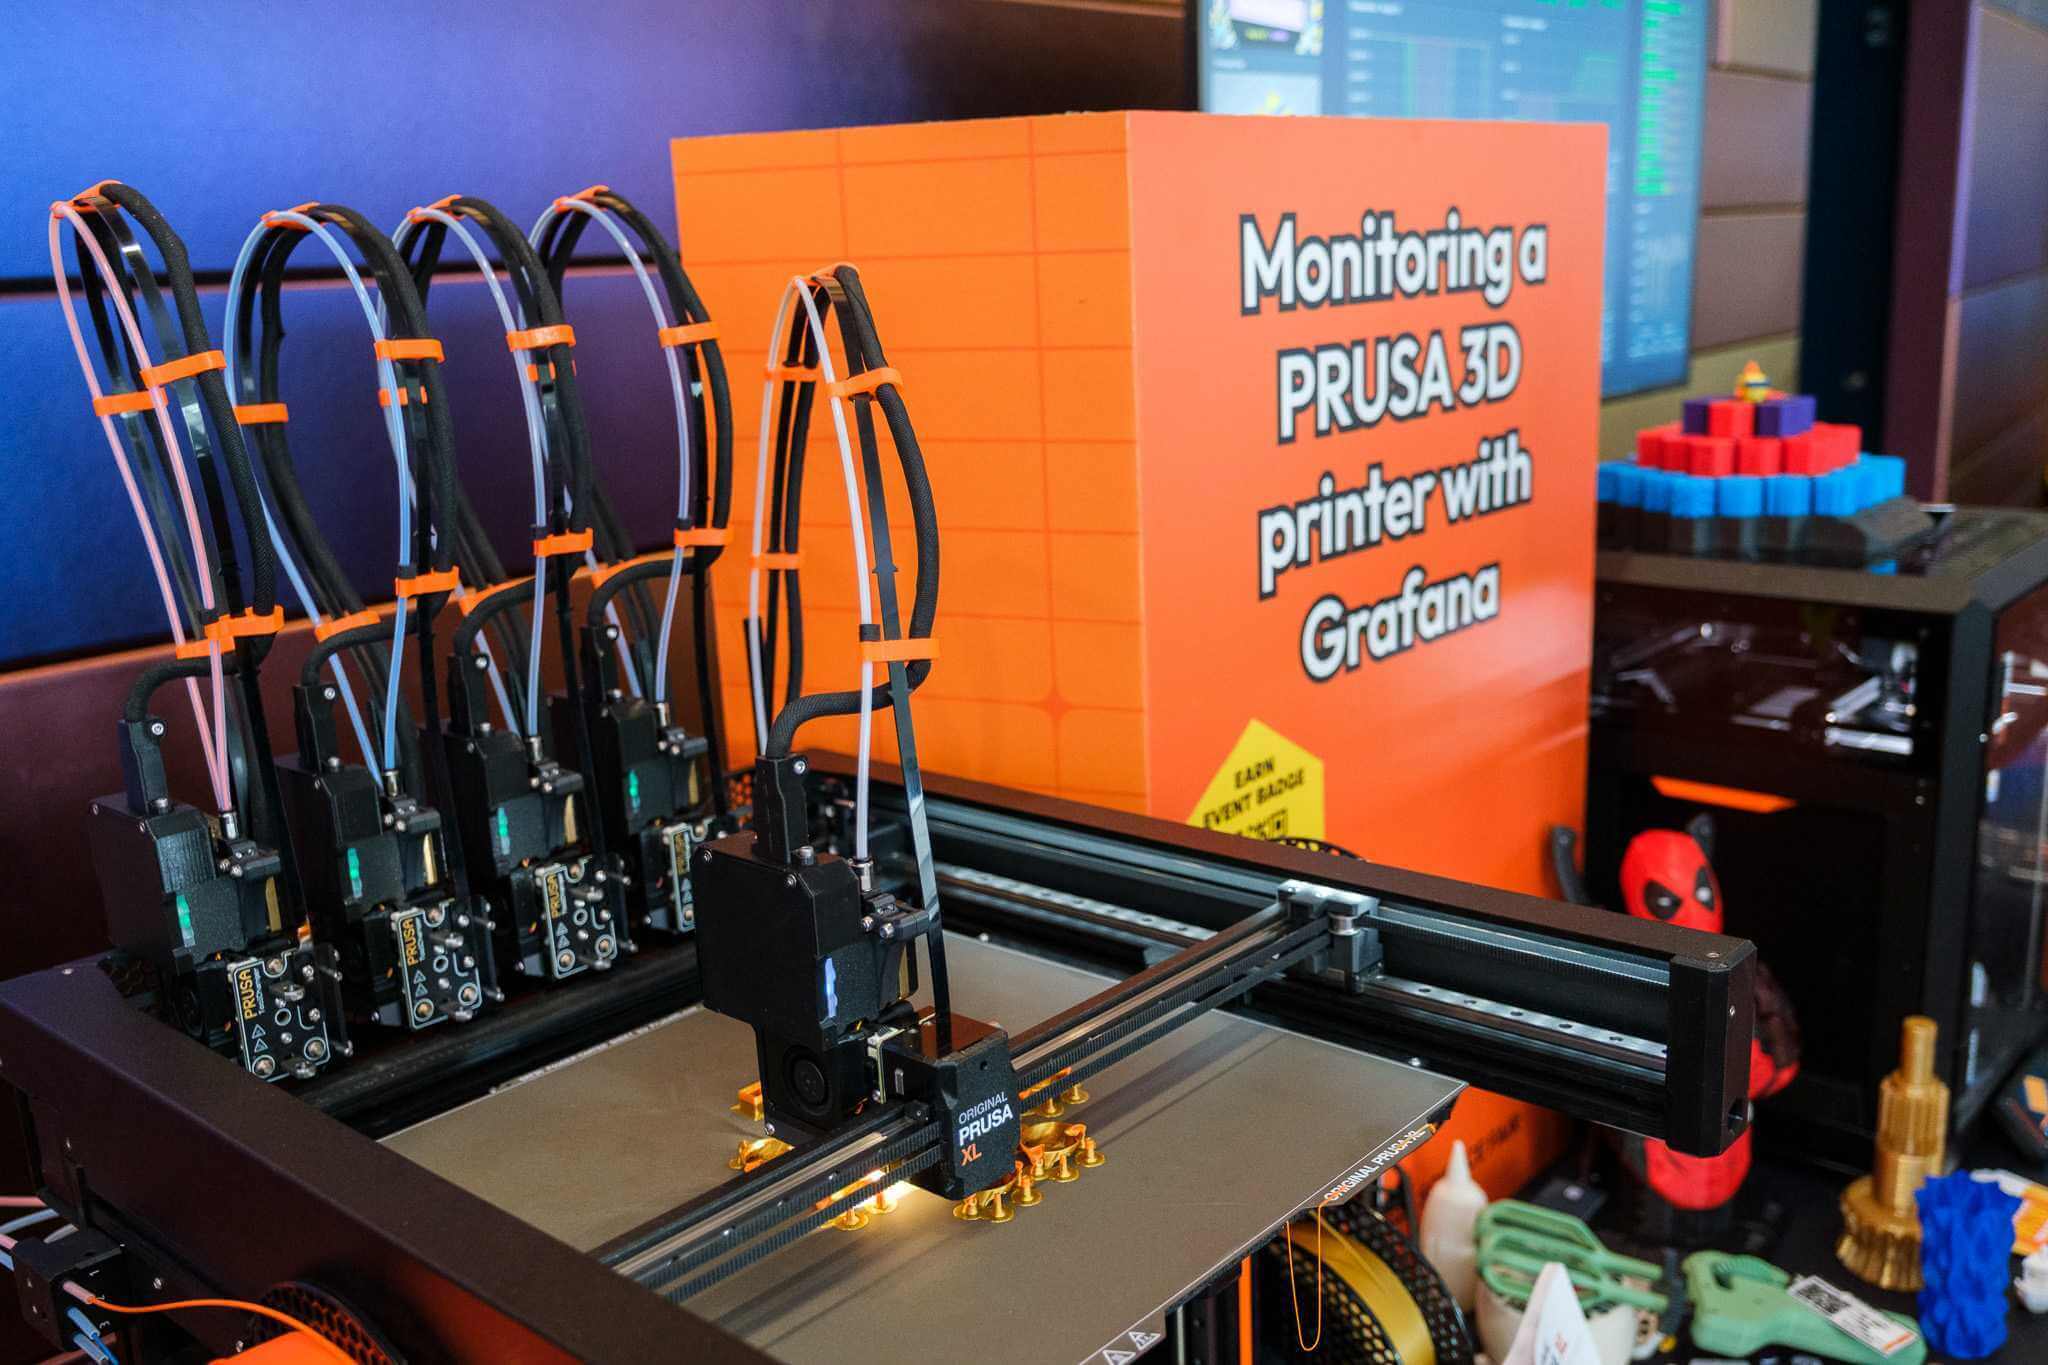
I enjoy it so much, in fact, that I even brought my setup to Seattle this week to be part of the GrafanaCON 2025 Science Fair.
What are exporters?
First things first. We are going to use Prometheus and exporters. If you aren’t already familiar with Prometheus, it’s a backend for metrics that not only stores data points but also collects them. It’s a pretty simple yet powerful tool, but if you need anything fancy, then you need to use extensions like Grafana Mimir.
And exporters? You have to get your data to Prometheus, and an exporter is one way to do it. It translates data from other formats into something Prometheus understands and exposes /metrics endpoints with data, and those can be scraped. The second way is to push metrics directly, but more about that later. First, we have to talk about what we have.
The possibilities
Your printer contains numerous sensors: load cell sensor, temperature sensors, voltmeters, ammeters, pulse width modulation, and much more. Those are values that can be very useful—sometimes.
If you are developing a modification of a Prusa printer, then you can find those values incredibly useful. For example, did you see that you can print on almost any surface with Nextruder? You can even print onto and into T-shirts! That’s because the extruder has a load cell sensor that measures the print bed. But what if you could use this sensor for something more? Something like…creating an analog controller from the sensor? Because you can, I suppose. Just imagine playing Doom with a Prusa Core One as a controller.
Okay, okay, we need to slow down and think rationally, right? With metrics and Grafana, you can do whatever you want. You can even create your own Prusa Link and control your 3D printer straight from Grafana. But in this case, you need to use a local Grafana instance or expose your printers to the world via your router, as the Prusa Link REST API is completely offline and it runs only in your network. And this API is where the story of prusa_exporter begins.
Embedded world challenges
Of course, it’s much easier to get, let’s say, business metrics from your e-shop than from a 3D printer. The embedded world is not so easy, and it’s mainly because of a lack of performance. If you have issues where you cannot serve your clients’ precious answers to their requests, then just change the number of backend pods and scale it up. You cannot do that with low-power Cortex MCUs.
Like your phone or computer, even 3D printers need their processors. It’s basically a CPU with everything needed in it, like memory and flash storage. Those chips are often very underpowered but extremely power-efficient and very, very reliable. Newer Prusa printers—XL, MK4 and Core One—are rocking 180 MHz ARM Cortex-M4 core with 256 kB of memory.
With that little performance, those devices need to be used for crucial parts of basic functioning like processing lines of g-code (g-code is a file that contains commands for 3D printers—and others as well). Unfortunately that makes metrics less important and you have to be careful what metrics are selected for exposure because too much of them slows down CPU.
Not only can a lot of data be too much for your network, but it is also very heavy on processing power. As I said, in embedded systems, you don’t have much processing power, and you need to be careful about what you are doing. Preprocessing metrics and exposing them at the /metrics endpoint is not as easy as in the cloud world.
Of course, it’s possible, but you need to do other things as well.
Offloading the burden
So basically, what we need to do is to offload this burden somewhere else. Just imagine you are sending 500 values of one metric to your server, and you need to process that. We have found that Prometheus is absolutely able to handle loads from several printers that are emitting such data. However, it’s much better not to send those metrics at all because if you are not a developer, they are not relevant.
For example, compare the difference between when load cell metrics are disabled:
And when they’re enabled:
Why do you need to process those metrics? If you are familiar with the line_protocol of InfluxDB, then just imagine that the printer sent a metric in almost this format. But the issue, again, is the lack of processing power. The printer is unable to send the whole timestamp that is required; it only sends how long the printer has been online and a delta in nanoseconds that can be used for the calculation of the correct value. And that is very CPU heavy.
Prusa Link as a simple approach
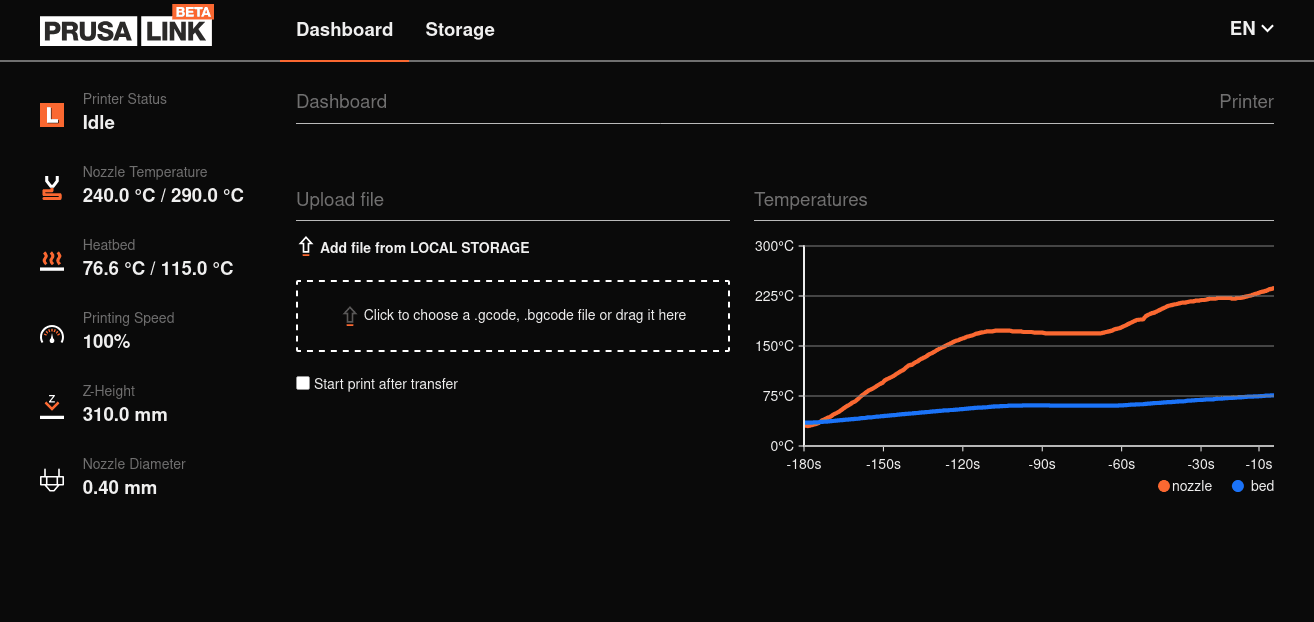
That’s why there are two types of approaches to solve this issue. If you want to go cheap and easy, you can just scrape the Prusa Link API, and you are good to go. You’ll get information about the actual job, how it’s progressing, the printed file image, temperatures, and many others. But what about the juice, like the load cell sensor data mentioned earlier?

Introducing prusa_metrics_handler
The approach that prusa_metrics_handler takes is different. It’s similar to the official Prusa metric handler you can find in the Buddy firmware repository, but it’s able to process data in parallel. And to be easier on the CPU, it does not compute the correct timestamp, which is a feature, not a bug.
In the case of generic monitoring, you don’t necessarily need the correct timestamp because the drift is in milliseconds, and if you want your dashboards nice and shiny, you are not going too deep to see if your metrics are absolutely correct.

Yes, it’s kind of cheating, but prusa_exporter is not meant for developers; it’s meant for hobbyists who like monitoring and observing. So I saved some of the processing power, and everything is nice and beautiful. Well, not so much at this moment, because we need one more component to translate line_protocol to Prometheus Remote Write. This is something that is going to be handled by the application itself, but for now, let’s use the influx2cortex proxy.
This proxy is able to accept line_protocol metrics and writes it into Cortex, which is a long-term storage solution for Prometheus. However, we are not going to use Cortex but Prometheus, and it’s very nice that those two have the same push protocol.
How the printer sends data
Oh my, I forgot to mention how the printer sends the actual data. When you enable metrics in settings, you activate the Syslog handler, which is used for data transport. To save processing power, UDP is used as a protocol, so there is a chance of losing a packet or two. However, the existence of that possibility does not mean it’s happening; more probable is that you’ll get an exception from Prometheus that data already exists.
Why? Prometheus’ internal TSDB is in milliseconds; however, printers send data in nanoseconds. The issue is that when we drop precision, we will introduce only slight shifts, but also duplicates can happen. Just imagine you have two values within 1,000 nanoseconds, and tada—two values with the same timestamp! Prometheus will reject the value, but technically you’ve lost one data point.

One more thing
Now we have prusa_exporter running, prusa_metrics_handler running, Grafana running, and Prometheus running, and everything is awesome, right? Yes, yes, it is. But wait, there is more. You can also ingest logs from the printer as well! You just need to spin up Grafana Loki and Promtail.
Well, you can do whatever supports RFC5424 Syslog and send values to Loki. But is there anything interesting in logs? It’s a log, what do you think? But yeah, digging in those lines is fun! For example, if you have the Prusa XL, then you can see logs from pressure advance calibration—isn’t that cool?
Setup?
Although prusa_exporter is not finalized, you can run a very early version right now. What will change (apart from optimization) is the fact that prusa_metrics_handler is going to be integrated into prusa_exporter; at this moment it’s a standalone application that needs to run alongside. Does it make them less capable? Not much, but it’s something that needs to be mentioned.
You can easily run the “ultimate” docker compose that is in the prusa_exporter repository, and it’s meant for running everything you need. Even though it’s a bit rough around the edges, it works pretty well, though it’s not optimized. For example you cannot run it on Raspberry Pi; you need something more powerful like some 4-core x86 CPU.

Conclusion and disclaimer
All of those little things are the quirks when it comes to Prusa 3D printers. Obviously, you need most of the CPU time for calculating movements, so why not offload metrics somewhere else? Just beware, prusa_exporter is not officially related to Prusa Research or any of its subsidiaries, and it’s a purely fun project that is still under development.
If you are interested in learning more about how to extract and process metrics, take a look at repositories with interesting code: Prusa-Firmware-Buddy, where you can learn how metrics work and see the first version of the official metrics_handler; prusa_exporter for exposing Prusa Link metrics (it also contains that ultimate docker-compose.yaml); and prusa_metrics_handlerfor handling metrics that are unavailable in Prusa Link. Enjoy!
Grafana Cloudis the easiest way to get started with metrics, logs, traces, dashboards, and more. We have a generous forever-free tier and plans for every use case. Sign up for free now!

