Queryless tracing for faster root-cause analysis: Grafana Traces Drilldown is generally available
When there’s an error spike in your microservices environment, every second counts. That’s why, last year, we introduced Grafana Traces Drilldown (previously Explore Traces), an application that allows you to quickly investigate and visualize your tracing data through a simplified, queryless experience.
This week at GrafanaCON 2025, we were thrilled to share that Traces Drilldown — which is part of our suite of Grafana Drilldown apps — is now generally available. Building on months of public preview feedback and lessons learned, this GA release delivers some powerful new features for deep-dive trace analysis and reducing MTTR. Let’s take a closer look.
Why queryless tracing changes the game
Modern microservice stacks emit a lot of metrics, logs, and traces. To translate this telemetry into the insights they need, engineers have historically had to write complex queries. Often, they’d need to bounce between various consoles and query languages — like PromQL and TraceQL, the query language designed for selecting traces in Grafana Tempo — making it tough and time-consuming to find answers and resolve issues.
We built our suite of Grafana Drilldown apps to break this cycle, enabling you to spend more time on problem-solving and less time writing queries.
Distributed tracing, in particular, has always been a tough domain to simplify, because a single request can fan out into hundreds or thousands of spans across dozens of services. During the public preview of Traces Drilldown, we saw operators shave precious minutes off their time-to-root-cause simply by pivoting from a RED-signal panel to the exact set of spans that mattered — again, no TraceQL required.
“Traces Drilldown has been a great tool when we’re unsure what’s going wrong in a service,” said Deepika Muthudeenathayalan and Alex Simion, software engineers at Glovo. “We like how quickly we can filter through traces and start finding clues. Being able to isolate specific span types (like root spans) makes it much easier to focus, deep dive into issues and understand if it’s a local or global problem of the service.”
Highlights of Traces Drilldown
Traces Drilldown gives incident responders, SREs, and developers a first-class, queryless path from an alert or detected anomaly to a high-fidelity span timeline. This leads to faster MTTR, fewer context-switches, and an investigation flow that mirrors the way teams actually chase down outages.
Queryless, context-first exploration
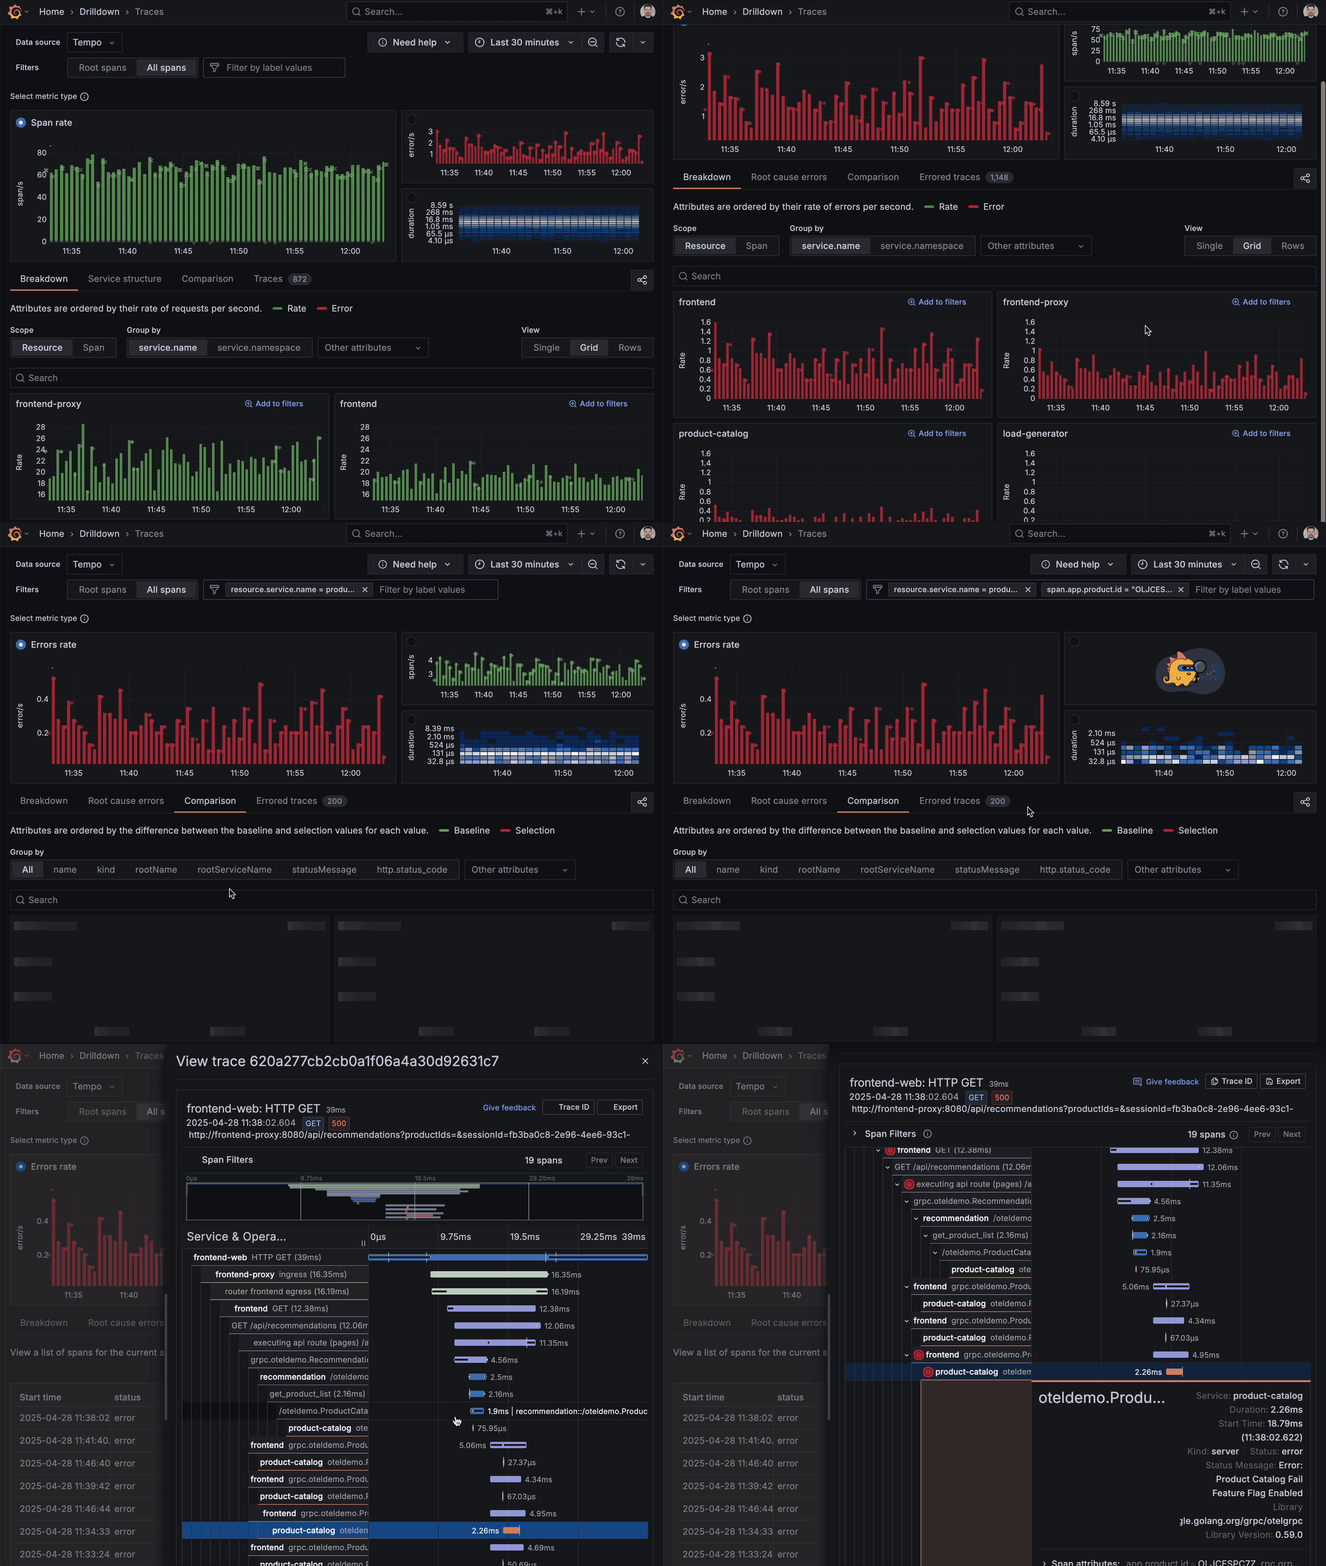
With Traces Drilldown, the investigation starts where your eyes already are: the RED (Rate, Errors, Duration) metrics that flag when something is wrong. These metrics are aggregated directly from your trace data, enabling instant visibility into service health without additional instrumentation. Because we want data to drive your decision-making, a click on any of them instantly pivots you to the exact set of traces behind the anomaly, without the trial-and-error of TraceQL filters. The app also pre-populates sensible groupings so you land on a meaningful subset of data.

Seamless navigation from macro to micro
With Traces Drilldown, you remain in the same, uninterrupted workflow whether you’re scanning a high-level error-rate chart or inspecting a set of individual traces. The filter selections preserve context, while point-and-click jumps carry you between levels, and it’s easy to navigate back.

Built-in investigative tools
Filtering, highlighting, breakdowns, comparisons, and root-cause correlations are embedded directly in the app. These built-in tools enable rapid trace assessment by pinpointing abnormalities, without the need for external tools. Need to isolate only traces slower than the 95th percentile? Make a selection on the span duration. Want to see how failed requests differ from successful ones? Switch to the Comparison tab, and let the app surface the divergent span attributes.
“The Comparison tab is especially valuable because it highlights which fields in a trace deviate from the baseline,” said Simion and Muthudeenathayalan.
High-fidelity trace view
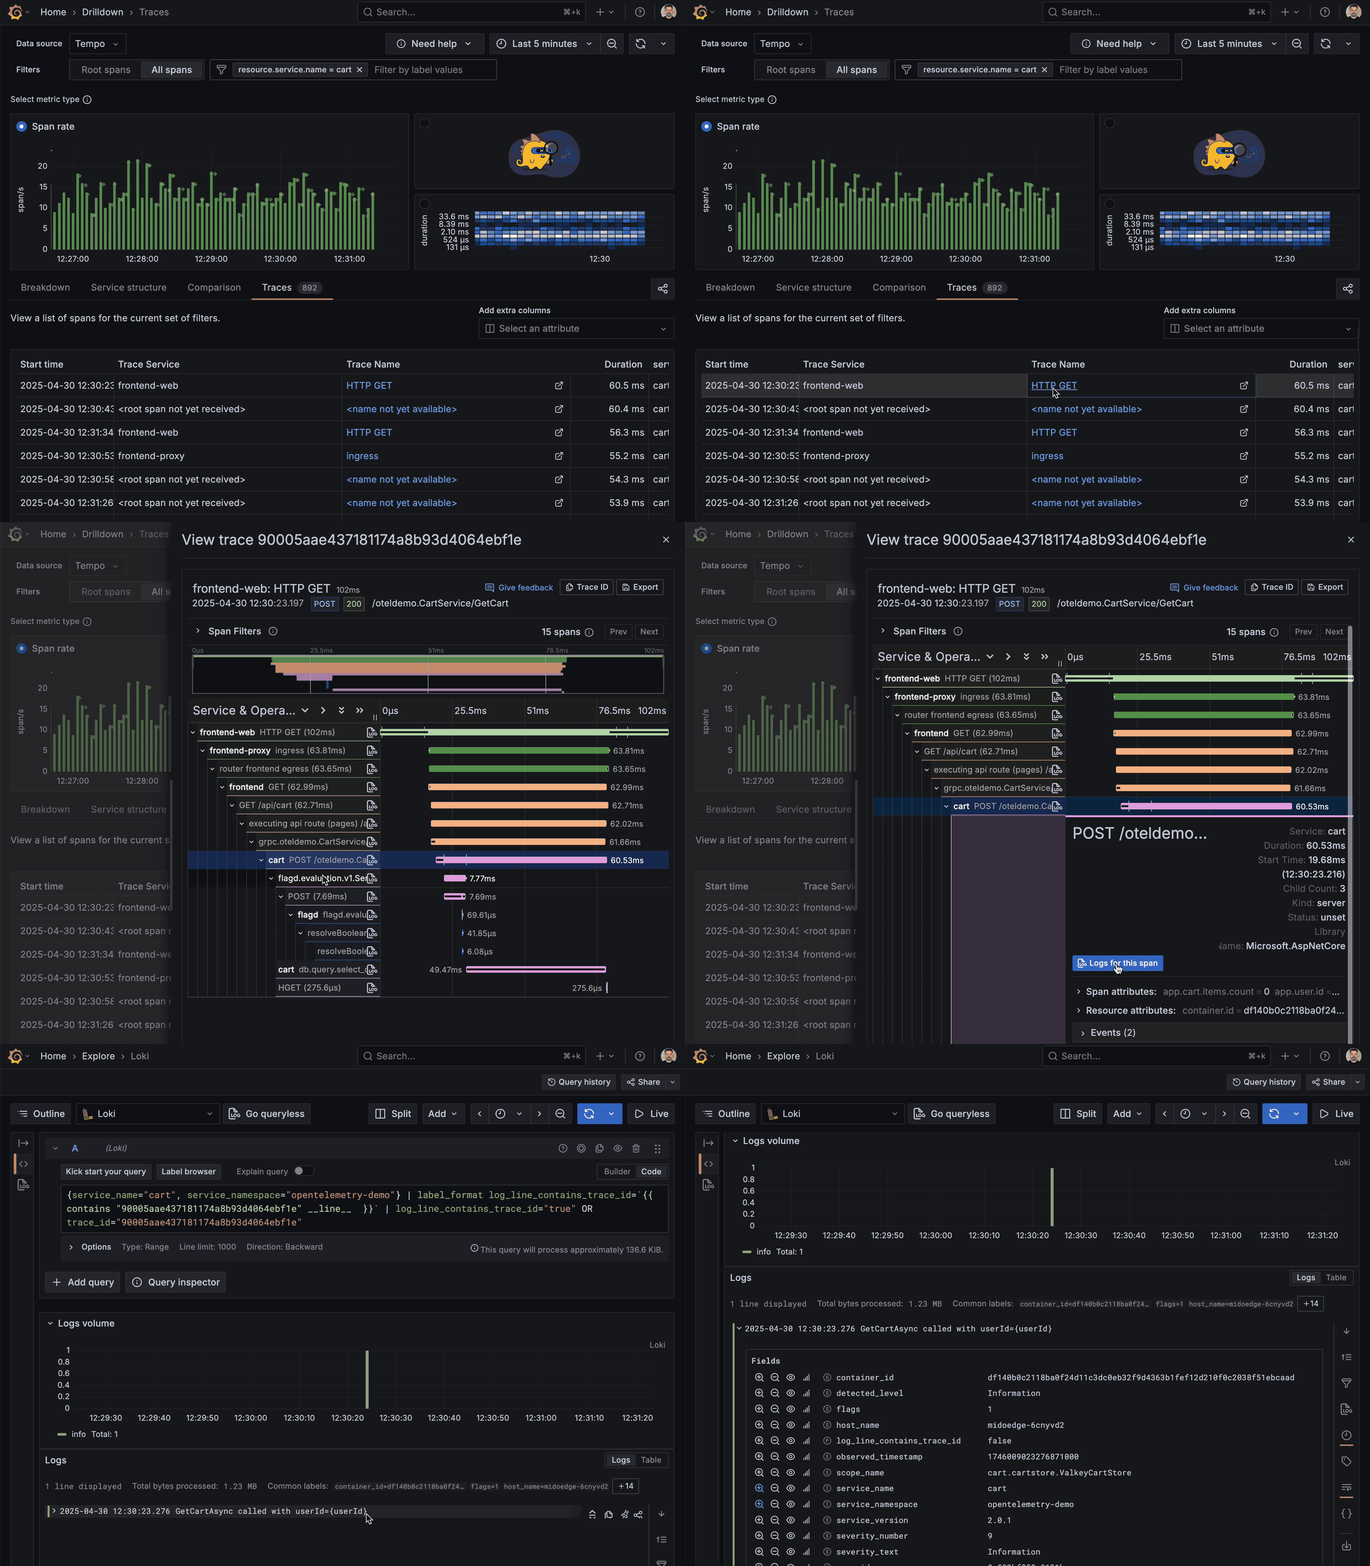
Once you’ve honed in on a single trace, the trace view shows a high-fidelity spans timeline to reveal key metadata, such as duration and status indicators. This helps you quickly identify the origin of performance bottlenecks and errors.
Unified observability experience
Traces Drilldown connects traces with logs, metrics, and profiles for a cohesive observability workflow. From the trace view, you can effortlessly jump to the relevant log line or open a flame graph for the same request — all without copy-pasting IDs or performing manual queries.

What’s new in Traces Drilldown
Here are a few recent updates we’ve made to Traces Drilldown to further enhance the user experience.
Exemplars that spotlight the story inside your metrics
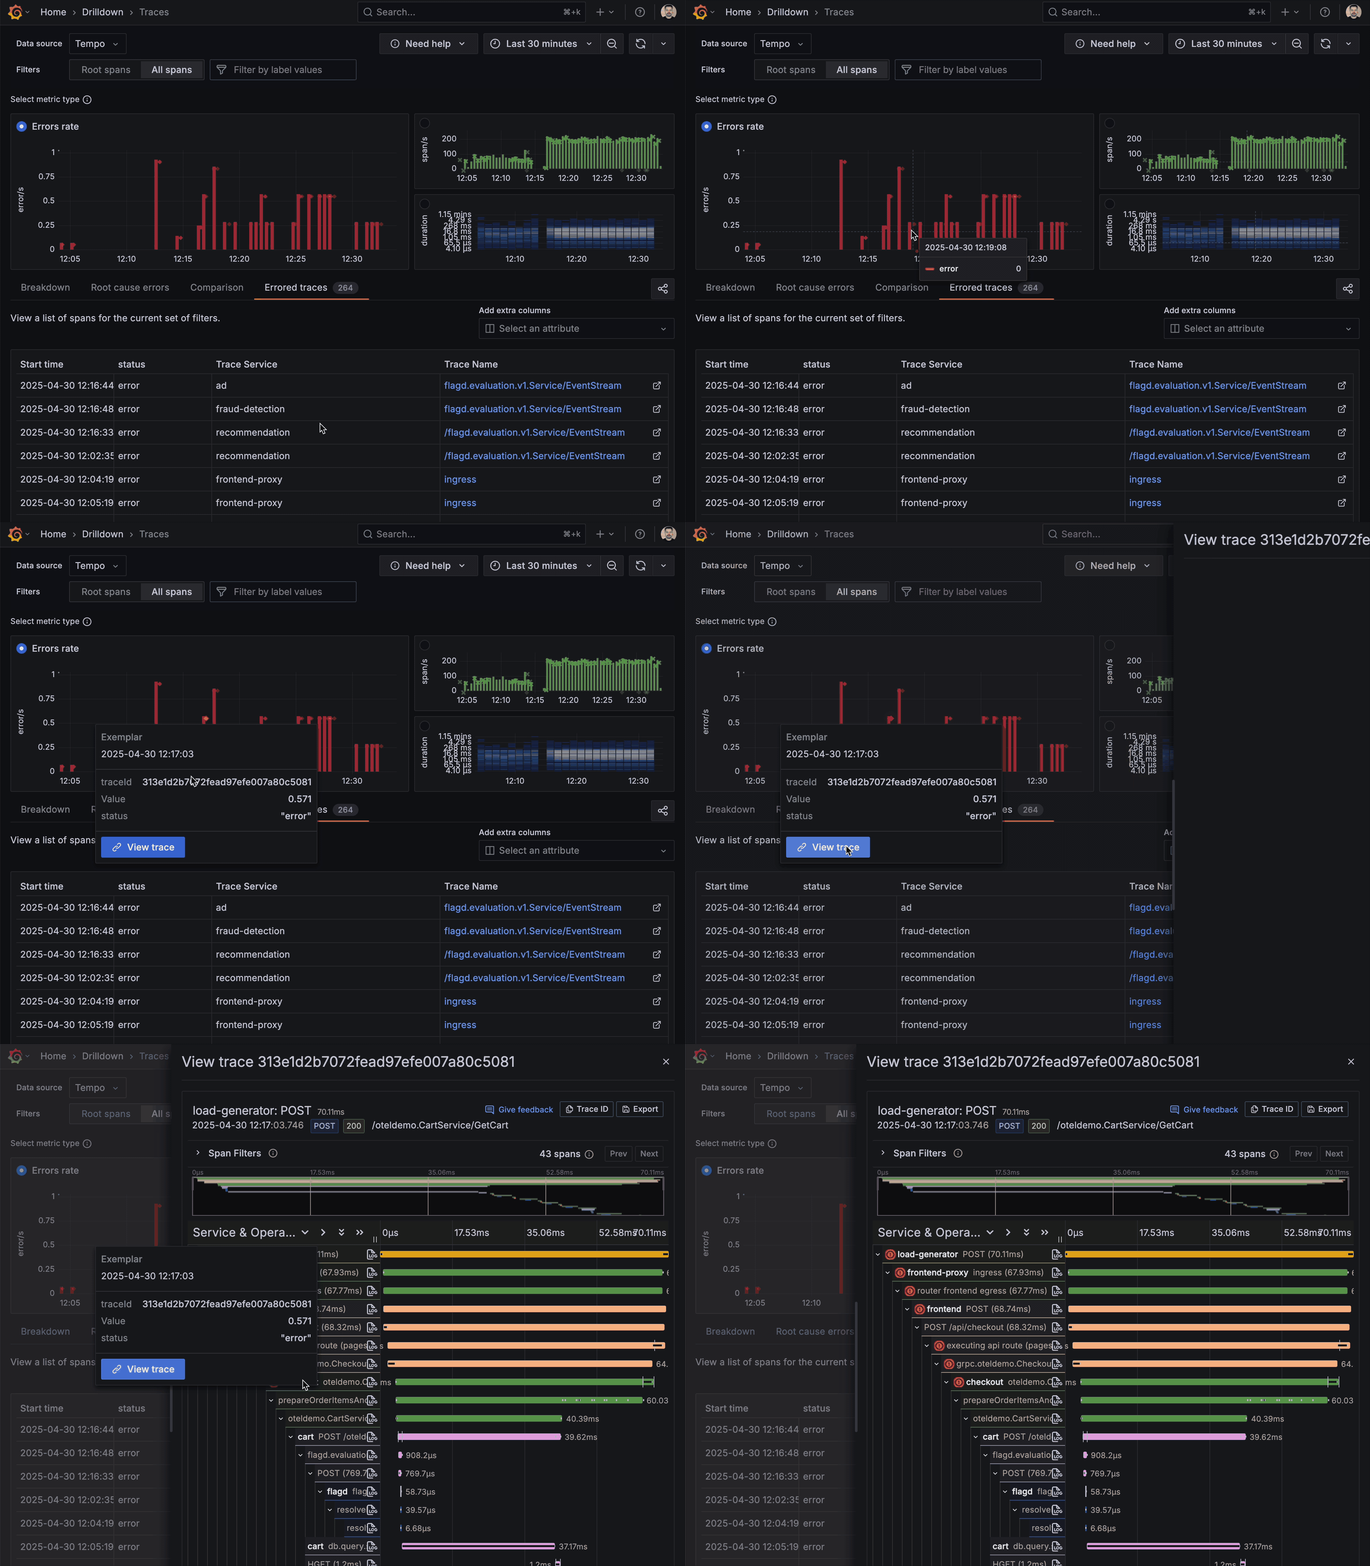
Now when inspecting your traces you can take advantage of integrated exemplars directly within the trace metrics. Exemplars highlight representative traces that capture critical events or anomalies, providing a quick visual summary of key operations within your trace data. They’re almost like an “example” of the problem you’re trying to solve, helping you correlate areas that warrant further investigation without having to manually sift through extensive trace details.

“By using exemplars it’s easy to jump from trace to trace in the timeline of the incident and understand the state of the issue at each moment,” said Simion and Muthudeenathayalan.
TraceQL streaming for faster feedback loops
With support for TraceQL query streaming, Traces Drilldown now delivers partial results as they come in, so you no longer have to wait for all results to finish processing before starting your analysis. You can start reviewing metrics immediately, adjust filters on the fly, and follow emerging patterns in real-time to find root causes faster.
Bug fixes and quality‑of‑life improvements
The GA release of Traces Drilldown also brings a host of stability and usability improvements. We’ve addressed a range of bugs reported during the public preview phase and made targeted adjustments to both overall performance and the user interface, ensuring smoother navigation and a better overall experience.
Investigations in Traces Drilldown: real-world workflows
Investigations in Traces Drilldown rarely follow a straight line, which is why we designed the UI to let you easily jump forward, back-track, or branch off, based on what you see in the data. Below are three common, non-linear journeys that show how core features — such as span-scope selection, RED-metric pivots, rich analysis tabs, and exemplars — work together in practice.
For these examples, let’s imagine we have an e-commerce website called AcmeShop that’s based on the OpenTelemetry Demomicroservices architecture. It consists of a polyglot frontend, cart and checkout services, a recommendation engine, and regional CDNs, all instrumented with the Grafana LGTM (Loki for logs, Grafana for visualization, Tempo for traces, Mimir for metrics) Stack.
Scenario 1. Error SLI metric flares
A sudden spike in HTTP 5xx responses hits the frontend-web service, breaking the checkout flow and tripping the error service-level indicator (SLI).
- One click on Errors in the RED metrics panel flips the workspace to error mode.
- Select All spans giving you a full view of all services that process failed requests.
- The Root cause errors tab instantly aggregates the most common error paths across hundreds or thousands of traces within the selected time range.
- You quickly narrow down most errors to an issue in the
paymentservice, and add it to the Filter bar. - Opening a sample trace in the Trace list reveals a 429 from the
paymentAPI. - The span attributes indicate a rate limiting issue with the third-party provider you’re using.
Scenario 2. Latency regression after a deploy
Minutes after rolling out a new version of the backend, the 95th-percentile latency for the cart API climbs well above its normal baseline and user complaints start trickling in.
- Starting from Root spans, you switch the signal to Duration and drag across the slowest percentile of the heatmap.
- The Root cause latency shows one service consistently on the critical path: the shopping
cartservice. - Jump to All Spans to see all service calls and use the Breakdown tab to zoom in on the service in question.
- The Comparison tab confirms the slowdown is unique to the service
cart, where requests serviced by the new version report a consistentdb.index.usage=INDEX_MISSattribute. - Opening the Trace list to pick the slowest trace, and in the detailed trace view, you see that database queries in the latest version of the
cart_itemstable couldn’t use an index for the query, hinting at a potential fix.
Scenario 3. Regional customer complaint
Your support team reports that product images load slowly for customers in Singapore, while performance elsewhere looks normal.
- Staying on Root spans, you select the Duration signal.
- The heatmap looks fine, so you filter by
imageLoadspans. - The Comparison points to
cdn.edge=sg-3as the only attribute skewing slow — zooming in on that edge node by adding it to the current filters. - Back to the metrics Breakdown, a diamond-shaped exemplar sitting on the latency metric opens to a full trace and uncovers a 5 second latency for the
ap-southeast-1CDN region, evidence that the team should open a ticket with the CDN provider.
Across these scenarios, you never typed a line of TraceQL. Instead, the data led you through a point-and-click journey enabling you to zoom in quickly on relevant traces.
Get started and get involved
Traces Drilldown comes pre-installed with Grafana 12. The app is also supported on previous minor releases of Grafana, starting with the Grafana 11.3 release, but requires manual installation. You can follow this quick “Access or install” guide in the docs.
If you’re on Grafana Cloud, Traces Drilldown is already enabled. Simply open Drilldown → Traces in the side menu and start exploring.
Your feedback and contributions will continue to shape the evolution of Traces Drilldown. Please share your experiences with us, or open an issue or pull request in grafana/traces-drilldown. We look forward to hearing from you!


