Generate test scripts from natural language with Grafana Assistant: introducing k6 Script AuthoringGrafana CloudGrafana Cloud k6AIPerformance Testing
Troubleshoot performance issues faster with the new Grafana Assistant integration for Database Observability AIDatabase Observability
Faster fixes, less context sharing: how Grafana Assistant learns your infrastructure before you even askAI
Secure performance testing at scale: Introducing secrets management for Grafana Cloud k6Grafana Cloud k6
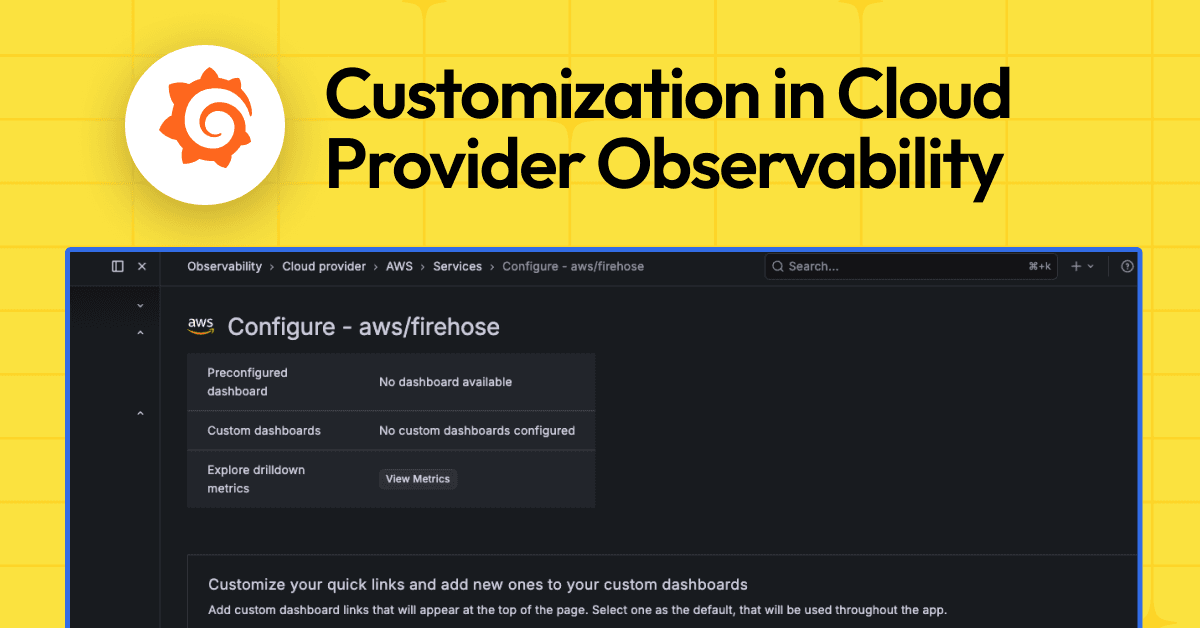
Customize preconfigured views for AWS, Azure, and Google Cloud with Cloud Provider Observability in Grafana CloudCloud Provider ObservabilityGrafana Cloud
AI Observability in Grafana Cloud: A complete solution for monitoring your agentic workloadsAIGrafana Cloud
Introducing Pyroscope 2.0: faster, more cost-effective continuous profiling at scaleGrafana PyroscopeContinuous profiling
Grafana 13 release: get value from your data faster, manage operations at scale, and more!GrafanaRelease
Grafana Labs acquires Logline to accelerate needle-in-the-haystack log queriesCompany newsLokiLogging
Cost attribution in Grafana Cloud: Manage spend across observability and testing workflows Grafana CloudCost managementSynthetic monitoringPerformance Testing
Grafana Labs named a Leader again in the 2026 Gartner® Magic Quadrant™ for Observability PlatformsGrafana Labs has been recognized as a Leader in the 2026 Gartner® Magic Quadrant™ for Observability Platforms for the third consecutive year.ObservabilityGrafana Cloud
Grafana 13.1 release: observability as code updates, extending Grafana Assistant across more data sources, and moreGrafanaRelease
Stop switching tools to find answers: Grafana Assistant now works across 30+ data sourcesAIGrafanaIntegrations
'Grafana's Big Tent' podcast: Anthropic on agentic coding, observability, and the future of software engineeringPodcastsAIObservability