Node exporter
On this page:
Introduction
The following quickstart provides setup instructions and preconfigured dashboards, alerting rules, and recording rules for Node Exporter. After running through the steps in this quickstart, you will have:
Set up and configured Node Exporter to collect Linux system metrics like CPU load and disk I/O. Node Exporter will expose these as Prometheus-style metrics.
Configured Prometheus to scrape Node Exporter metrics and optionally ship them to Grafana Cloud.
Set up a preconfigured and curated set of recording rules to cache frequent queries.
Imported Grafana dashboards to visualize your metrics data.
Set up Prometheus alerting rules to alert on your metrics data.
Metrics usage
This exporter publishes roughly 500 Prometheus time series by default. To see a list of metrics shipped by default with this exporter, please download a sample metrics scrape here.
Note that depending on its configuration, Node Exporter may collect and publish far more metrics than this default set. To learn more about configuring Node Exporter and toggling its collectors, please see the Node Exporter GitHub repository.
Beyond toggling Node Exporter’s settings, you can reduce metrics usage by dropping time series you don’t need to store in Prometheus or Grafana Cloud. To learn how to do this, please see Reducing Prometheus metrics usage with relabeling from the Grafana Cloud docs.
Grafana Cloud’s Linux Node Integration
If you’re using Grafana Cloud, you can skip all of the steps in this guide by installing the Linux Server Integration, which is designed to help you get up and running in a few commands and clicks. Sign up for free.
To learn how to set up Node Exporter using the Linux Server Integration, please see Monitoring a Linux host using the Linux host integration from the Grafana Cloud docs.
On this page:
Node exporter quickstart
In this guide you’ll learn how to set up and configure Node Exporter to collect Linux system metrics like CPU load and disk I/O and expose them as Prometheus-style metrics. You’ll then configure Prometheus to scrape Node Exporter metrics and optionally ship them to Grafana Cloud. Finally, you’ll set up a preconfigured and curated set of recording rules, Grafana dashboards, and alerting rules. At the end of this guide you’ll have dashboards that you can use to visualize your Linux system metrics, and set of preconfigured alerts.
If you’re using Grafana Cloud, the Linux Server Integration can help you get up and running quickly. The Linux Integration embeds Node Exporter into the Grafana Agent and automatically provisions alerting rules and dashboards, so you don’t have to run through the steps in this guide. To learn how to set up Node Exporter using the Linux Server Integration, please see Monitoring a Linux host using the Linux host integration from the Grafana Cloud docs.
Prerequisites
Before you get started, you should have the following available to you:
- A Linux machine compatible with a Node Exporter release. To see a list of available releases, please see Releases.
- Prometheus running in your environment or directly on the Linux machine. To learn how to install Prometheus, please see Installation from the Prometheus docs.
- Grafana running in your environment or directly on the Linux machine. To learn how to install Grafana, please see Install Grafana from the Grafana docs.
- (Optional) A Grafana Cloud account. Grafana Cloud hosts Grafana and a Mimir-based Prometheus metrics endpoint. You will still need to scrape metrics, using either Prometheus installed in your environment, or the Grafana Agent. To learn more about Grafana Cloud, please see Grafana Cloud.
Step 1: Setting up Node Exporter
In this step you’ll set up Node Exporter on your Linux machine to collect and expose system metrics.
To begin, log in to your machine and download the relevant Node Exporter binary. In this guide we’ll use linux-amd64 but you should choose the one corresponding to your system’s OS and architecture:
wget https://github.com/prometheus/node_exporter/releases/download/v1.1.1/node_exporter-1.1.1.linux-amd64.tar.gzReplace 1.1.1 with the version you’d like to install. This guide may become stale so it’s best to check the Node Exporter Releases page for the latest stable version.
Unzip the tarball and cd into the directory:
tar xvfz node_exporter-*.*-amd64.tar.gz
cd node_exporter-*.*-amd64Run the Node Exporter binary:
./node_exporterlevel=info ts=2021-02-15T03:35:18.396Z caller=node_exporter.go:178 msg="Starting node_exporter" version="(version=1.1.1, branch=HEAD, revision=4e837d4da79cc59ee3ed1471ba9a0d9547e95540)"
level=info ts=2021-02-15T03:35:18.396Z caller=node_exporter.go:179 msg="Build context" build_context="(go=go1.15.8, user=root@7abcc101f1c2, date=20210213-13:30:54)"
level=warn ts=2021-02-15T03:35:18.396Z caller=node_exporter.go:181 msg="Node Exporter is running as root user. This exporter is designed to run as unpriviledged user, root is not required."
level=info ts=2021-02-15T03:35:18.397Z caller=filesystem_common.go:74 collector=filesystem msg="Parsed flag --collector.filesystem.ignored-mount-points" flag=^/(dev|proc|sys|var/lib/docker/.+)($|/)
level=info ts=2021-02-15T03:35:18.397Z caller=filesystem_common.go:76 collector=filesystem msg="Parsed flag --collector.filesystem.ignored-fs-types" flag=^(autofs|binfmt_misc|bpf|cgroup2?|configfs|debugfs|devpts|devtmpfs|fusectl|hugetlbfs|iso9660|mqueue|nsfs|overlay|proc|procfs|pstore|rpc_pipefs|securityfs|selinuxfs|squashfs|sysfs|tracefs)$
level=info ts=2021-02-15T03:35:18.397Z caller=node_exporter.go:106 msg="Enabled collectors"
level=info ts=2021-02-15T03:35:18.397Z caller=node_exporter.go:113 collector=arp
level=info ts=2021-02-15T03:35:18.397Z caller=node_exporter.go:113 collector=bcache
. . .
level=info ts=2021-02-15T03:38:01.468Z caller=node_exporter.go:113 collector=zfs
level=info ts=2021-02-15T03:38:01.468Z caller=node_exporter.go:195 msg="Listening on" address=:9100
level=info ts=2021-02-15T03:38:01.468Z caller=tls_config.go:191 msg="TLS is disabled." http2=falseIf you see the above output, you successfully ran Node Exporter.
Node Exporter publishes your system metrics in Prometheus format on port 9100. You can test this using curl. You will need to open a new SSH session or background the Node Exporter process to use curl.
curl http://localhost:9100/metrics. . .
process_virtual_memory_max_bytes 1.8446744073709552e+19
## HELP promhttp_metric_handler_errors_total Total number of internal errors encountered by the promhttp metric handler.
## TYPE promhttp_metric_handler_errors_total counter
promhttp_metric_handler_errors_total{cause="encoding"} 0
promhttp_metric_handler_errors_total{cause="gathering"} 0
## HELP promhttp_metric_handler_requests_in_flight Current number of scrapes being served.
## TYPE promhttp_metric_handler_requests_in_flight gauge
promhttp_metric_handler_requests_in_flight 1
## HELP promhttp_metric_handler_requests_total Total number of scrapes by HTTP status code.
## TYPE promhttp_metric_handler_requests_total counter
promhttp_metric_handler_requests_total{code="200"} 0
promhttp_metric_handler_requests_total{code="500"} 0
promhttp_metric_handler_requests_total{code="503"} 0If you see the above output, you’re ready to begin scraping Node Exporter metrics using Prometheus.
To avoid running and managing Node Exporter from the command line, you can create a systemd service. To learn how to do this, please see Creating a systemd service to manage the agent. Replace the path to the agent binary with the path to Node Exporter.
Step 2: Scraping Node Exporter using Prometheus
Now that Node Exporter is up and running on your machine, you can configure a Prometheus scrape job to collect and store Node Exporter metrics.
Add the following scrape job config to the scrape_configs section of your prometheus.yml configuration file:
- job_name: node
  static_configs:
- targets: ['linux_machine_IP_address:9100']Replace linux_machine_IP_address with the IP address of the machine running Node Exporter. If you’re running Prometheus on the same machine, this will be localhost. To learn more about configuring Prometheus, please see Configuration from the Prometheus docs.
If you don’t have a prometheus.yml configuration file, create a simple one using your favorite text editor. Open your preferred text editor and paste in the following Prometheus configuration:
global:
  scrape_interval: 15s

scrape_configs:
- job_name: node
  static_configs:
- targets: ['linux_machine_IP_address:9100']This configuration tells Prometheus to scrape all jobs every 15 seconds. The only configured scrape job is called node and defines a linux_machine_IP_address:9100 target. By default, Prometheus will scrape the /metrics endpoint using HTTP.
Save and close the file. You can then run Prometheus with the file using the following command:
./prometheus --config.file=./prometheus.ymlShipping metrics to Grafana Cloud
To ship Node Exporter metrics to Grafana Cloud from Prometheus, configure the remote_write parameter in your prometheus.yml configuration file. To learn more, please see Metrics — Prometheus from the Grafana Cloud docs. To learn more about the remote_write parameter, please see remote_write from the Prometheus docs.
Step 3: Configuring recording rules
Using recording rules, you can precompute and cache frequently queried metrics. For example, if a dashboard panel uses a computationally intensive query like a rate(), you can create a recording rule that runs at a regular reduced interval and saves the result of the intensive query in a new time series. This avoids fetching and computing data every time the dashboard gets refreshed. To learn more about Prometheus recording rules, please see Recording Rules from the Prometheus docs.
You should load the following recording rules before loading the dashboards in this guide. The dashboard queries use recording rules to reduce load on the Prometheus or Grafana Cloud Metrics servers, depending on where you’re evaluating the rules.
You can fetch the recording rule YAML file here.
Load recording rules into Prometheus
To load recording rules into Prometheus, add the following to your prometheus.yml configuration file:
rule_files:
- "node_exporter_recording_rules.yml"Be sure to replace node_exporter_recording_rules.yml with the path to your Node Exporter recording rules YAML file.
Load recording rules into Grafana Cloud
To learn how to load recording rules into Grafana Cloud, please see Prometheus and Loki rules with cortextool.
Step 4: Configuring dashboards
This quickstart includes the following three dashboards:
- Nodes Dashboard
- USE Method / Node Dashboard
- USE Method / Cluster Dashboard
To learn how to import these dashboards into Grafana, please see Importing a dashboard from the Grafana docs.
The dashboard queries depend on the recording rules defined in the previous step. Be sure to import these before importing the dashboards.
You can fetch the dashboards here.
Step 5: Configuring alerts
With Prometheus alerting rules, you can define alerts that fire when PromQL expressions breach some threshold or satisfy specified conditions over a period of time. For example, you can define a HighRequestLatency alert that fires when a request latency metric is greater than some threshold over a period of time. As soon as the alerting condition is triggered, the alert moves into Pending state. After satisfying the condition for the period of time defined by the for parameter, the alert moves into Firing state. You can configure routing and notifications for firing alerts using a tool like Alertmanager. Alertmanager is also built-in to Grafana Cloud.
You can fetch the alerting rule YAML file here.
Load alerting rules into Prometheus
To load alerting rules into Prometheus, add the following to your prometheus.yml configuration file:
rule_files:
- "node_exporter_alerting_rules.yml"Be sure to replace node_exporter_alerting_rules.yml with the path to your Node Exporter alerting rules YAML file.
Load alerting rules into Grafana Cloud
To learn how to load alerting rules into Grafana Cloud, please see Prometheus and Loki rules with cortextool.
Conclusion
In this quickstart you installed and ran Node Exporter on your Linux machine. You then configured Prometheus to scrape the system metrics exposed by Node Exporter. You loaded recording rules and alerting rules into Prometheus, and finally imported Grafana dashboards to visualize your Linux system metrics.
If you’re using Grafana Cloud, you can skip all of the steps in this guide by installing the Linux Server integration with the Grafana Agent. This integration embeds a preconfigured Node Exporter into the agent and automatically provisions Grafana dashboards and Prometheus alerting and recording rules, so you don’t have to import them manually. To learn how to set up the Linux Server integration, please see Monitoring a Linux host using the Linux host integration.
The dashboards, recording rules, and alerting rules were generated using the Node Exporter Mixin. Mixins are reusable templates for dasboards, recording rules, and alerts curated and designed by subject matter experts. To learn more, please see the Node Mixin repository.
On this page:
You should load the following recording rules before loading the dashboards in this guide. The dashboard queries use recording rules to reduce load on the Prometheus or Grafana Cloud Metrics servers, depending on where you’re evaluating the rules.
This quickstart includes the following recording rules:
instance:node_num_cpu:suminstance:node_cpu_utilisation:rate1minstance:node_load1_per_cpu:ratioinstance:node_memory_utilisation:ratioinstance:node_vmstat_pgmajfault:rate1minstance_device:node_disk_io_time_seconds:rate1minstance_device:node_disk_io_time_weighted_seconds:rate1minstance:node_network_receive_bytes_excluding_lo:rate1minstance:node_network_transmit_bytes_excluding_lo:rate1minstance:node_network_receive_drop_excluding_lo:rate1minstance:node_network_transmit_drop_excluding_lo:rate1m
"groups":
- "name": "node-exporter.rules"
  "rules":
  - "expr": |
      count without (cpu) (
        count without (mode) (
          node_cpu_seconds_total{job="node"}
        )
      )
    "record": "instance:node_num_cpu:sum"
  - "expr": |
      1 - avg without (cpu, mode) (
        rate(node_cpu_seconds_total{job="node", mode="idle"}[1m])
      )
    "record": "instance:node_cpu_utilisation:rate1m"
  - "expr": |
      (
        node_load1{job="node"}
      /
        instance:node_num_cpu:sum{job="node"}
      )
    "record": "instance:node_load1_per_cpu:ratio"
  - "expr": |
      1 - (
        node_memory_MemAvailable_bytes{job="node"}
      /
        node_memory_MemTotal_bytes{job="node"}
      )
    "record": "instance:node_memory_utilisation:ratio"
  - "expr": |
      rate(node_vmstat_pgmajfault{job="node"}[1m])
    "record": "instance:node_vmstat_pgmajfault:rate1m"
  - "expr": |
      rate(node_disk_io_time_seconds_total{job="node", device!=""}[1m])
    "record": "instance_device:node_disk_io_time_seconds:rate1m"
  - "expr": |
      rate(node_disk_io_time_weighted_seconds_total{job="node", device!=""}[1m])
    "record": "instance_device:node_disk_io_time_weighted_seconds:rate1m"
  - "expr": |
      sum without (device) (
        rate(node_network_receive_bytes_total{job="node", device!="lo"}[1m])
      )
    "record": "instance:node_network_receive_bytes_excluding_lo:rate1m"
  - "expr": |
      sum without (device) (
        rate(node_network_transmit_bytes_total{job="node", device!="lo"}[1m])
      )
    "record": "instance:node_network_transmit_bytes_excluding_lo:rate1m"
  - "expr": |
      sum without (device) (
        rate(node_network_receive_drop_total{job="node", device!="lo"}[1m])
      )
    "record": "instance:node_network_receive_drop_excluding_lo:rate1m"
  - "expr": |
      sum without (device) (
        rate(node_network_transmit_drop_total{job="node", device!="lo"}[1m])
      )
"record": "instance:node_network_transmit_drop_excluding_lo:rate1m"This recording rule YAML file was generated using the Node Exporter mixin. It uses the job=node label selector to query metrics by default. If you need to use a different selector, modify the selector in config.libsonnet and regenerate the dashboard following the instructions in the mixin repository.
On this page:
Note: These dashboards depend on the recording rules in the previous tab. Be sure to import these before importing the dashboards.
Nodes Dashboard
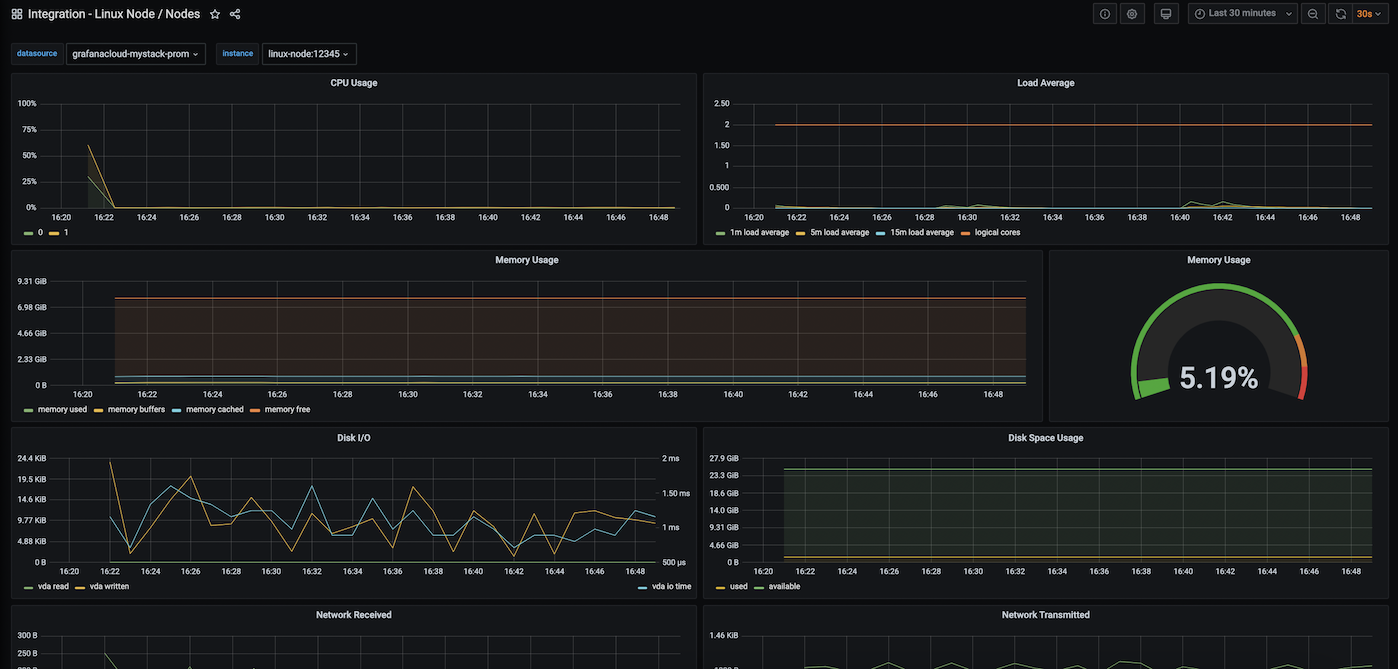
This dashboard includes panels for the following metrics:
- CPU Usage
- Load Average
- Memory Usage
- Disk I/O
- Disk Usage
- Network Received
- Network Transmitted
You can import the dashboard directly using the following dashboard ID: 13978
You can also download the dashboard JSON directly here.
USE Method / Node Dashboard
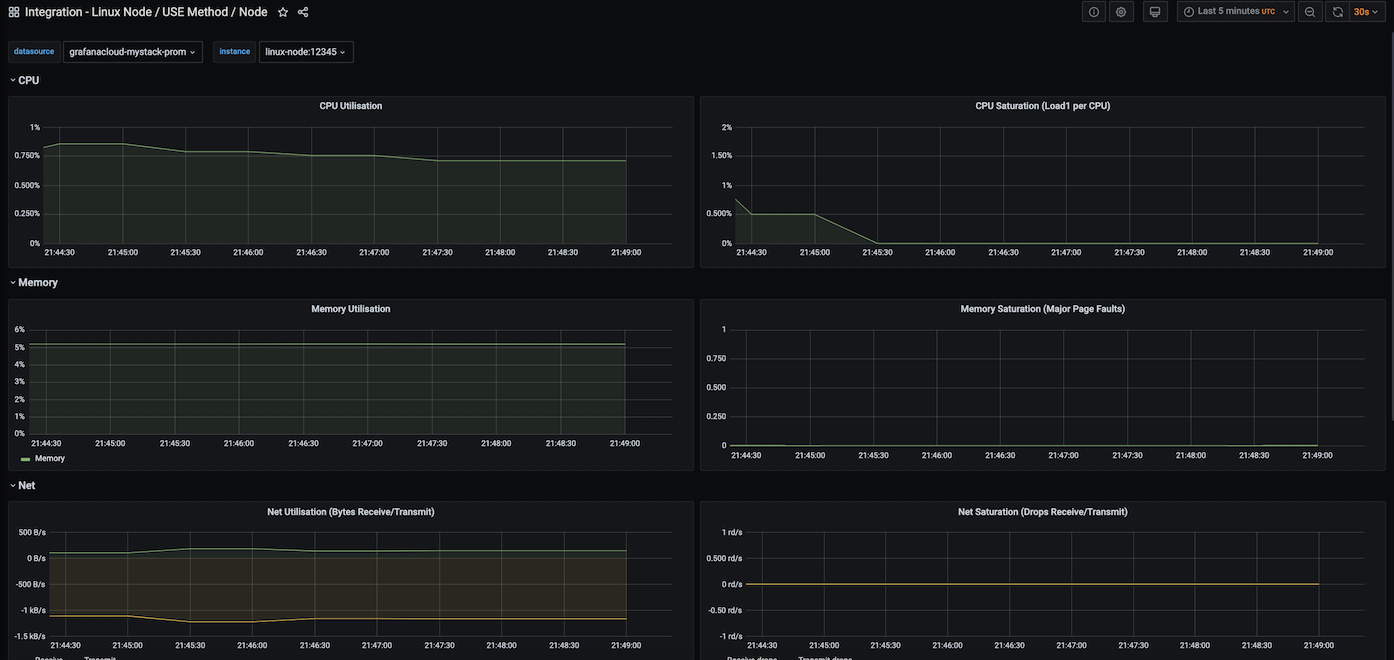
This dashboard includes panels for the following metrics. To learn more about USE (Utilization, Saturation, and Errors) metrics, please see The USE Method:
- CPU Utilization
- CPU Saturation (Load per CPU)
- Memory Utilisation
- Memory Saturation (Major Page Faults)
- Net Utilization (Bytes Receive/Transmit)
- Net Saturation (Drops Receive/Transmit)
- Disk I/O Utilization
- Disk I/O Saturation
You can import the dashboard directly using the following dashboard ID: 13977
You can also download the dashboard JSON directly here.
USE Method / Cluster Dashboard
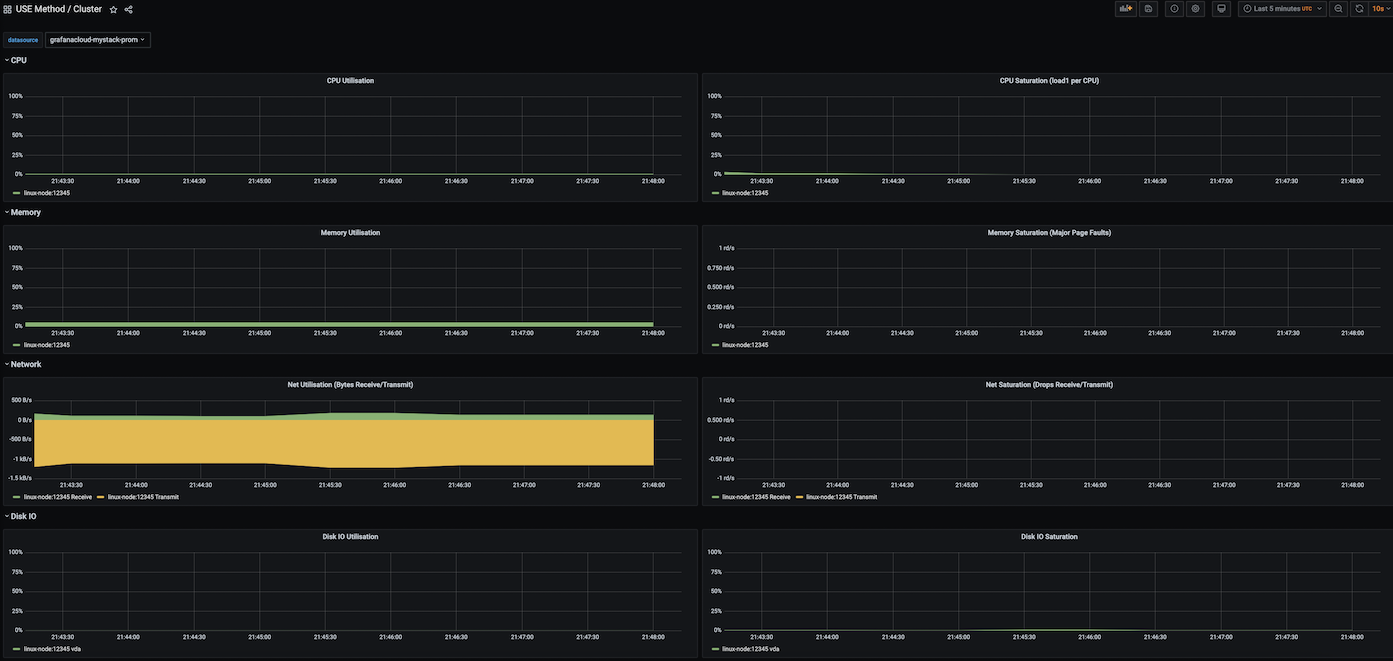
This dashboard is similar to the USE Method / Node Dashboard but provides a cluster-level view of the same metrics. It includes panels for the following metrics:
- CPU Utilization
- CPU Saturation (Load per CPU)
- Memory Utilisation
- Memory Saturation (Major Page Faults)
- Net Utilization (Bytes Receive/Transmit)
- Net Saturation (Drops Receive/Transmit)
- Disk I/O Utilization
- Disk I/O Saturation
You can import the dashboard directly using the following dashboard ID: 13971
You can also download the dashboard JSON directly here.
These dashboards were generated using the Node Exporter mixin. They use the job=node label selector to query metrics by default. If you need to use a different selector, modify the selector in config.libsonnet and regenerate the dashboard following the instructions in the mixin repository.
On this page:
This quickstart includes the following alerting rules:
NodeFilesystemSpaceFillingUpFilesystem on device at instace has only X available space left and is filling up.
NodeFilesystemAlmostOutOfSpaceFilesystem on device at instance has only X available space left.
NodeFilesystemFilesFillingUpFilesystem on device at instance has only X available inodes left and is filling up.
NodeFilesystemAlmostOutOfFilesFilesystem on device at instance has only X available inodes left
NodeNetworkReceiveErrsInstance interface device has encountered X receive errors in the last two minutes.
NodeHighNumberConntrackEntriesUsed% of conntrack entries are used.
NodeTextFileCollectorScrapeErrorNode Exporter text file collector failed to scrape.
NodeClockSkewDetectedClock on instance is out of sync by more than 300s. Ensure NTP is configured correctly on this host.
NodeClockNotSynchronisingClock on instance is not synchronising. Ensure NTP is configured on this host.
NodeRAIDDegradedRAID array ‘device’ on instance is in degraded state due to one or more disks failures. Number of spare drives is insufficient to fix issue automatically.
NodeRAIDDiskFailureAt least one device in RAID array on instance failed. Array ‘device’ needs attention and possibly a disk swap.
"groups":
- "name": "node-exporter"
  "rules":
  - "alert": "NodeFilesystemSpaceFillingUp"
    "annotations":
      "description": "Filesystem on {{ $labels.device }} at {{ $labels.instance }} has only {{ printf \"%.2f\" $value }}% available space left and is filling up."
      "summary": "Filesystem is predicted to run out of space within the next 24 hours."
    "expr": |
      (
        node_filesystem_avail_bytes{job="node",fstype!=""} / node_filesystem_size_bytes{job="node",fstype!=""} * 100 < 40
      and
        predict_linear(node_filesystem_avail_bytes{job="node",fstype!=""}[6h], 24*60*60) < 0
      and
        node_filesystem_readonly{job="node",fstype!=""} == 0
      )
    "for": "1h"
    "labels":
      "severity": "warning"
  - "alert": "NodeFilesystemSpaceFillingUp"
    "annotations":
      "description": "Filesystem on {{ $labels.device }} at {{ $labels.instance }} has only {{ printf \"%.2f\" $value }}% available space left and is filling up fast."
      "summary": "Filesystem is predicted to run out of space within the next 4 hours."
    "expr": |
      (
        node_filesystem_avail_bytes{job="node",fstype!=""} / node_filesystem_size_bytes{job="node",fstype!=""} * 100 < 20
      and
        predict_linear(node_filesystem_avail_bytes{job="node",fstype!=""}[6h], 4*60*60) < 0
      and
        node_filesystem_readonly{job="node",fstype!=""} == 0
      )
    "for": "1h"
    "labels":
      "severity": "critical"
  - "alert": "NodeFilesystemAlmostOutOfSpace"
    "annotations":
      "description": "Filesystem on {{ $labels.device }} at {{ $labels.instance }} has only {{ printf \"%.2f\" $value }}% available space left."
      "summary": "Filesystem has less than 5% space left."
    "expr": |
      (
        node_filesystem_avail_bytes{job="node",fstype!=""} / node_filesystem_size_bytes{job="node",fstype!=""} * 100 < 5
      and
        node_filesystem_readonly{job="node",fstype!=""} == 0
      )
    "for": "1h"
    "labels":
      "severity": "warning"
  - "alert": "NodeFilesystemAlmostOutOfSpace"
    "annotations":
      "description": "Filesystem on {{ $labels.device }} at {{ $labels.instance }} has only {{ printf \"%.2f\" $value }}% available space left."
      "summary": "Filesystem has less than 3% space left."
    "expr": |
      (
        node_filesystem_avail_bytes{job="node",fstype!=""} / node_filesystem_size_bytes{job="node",fstype!=""} * 100 < 3
      and
        node_filesystem_readonly{job="node",fstype!=""} == 0
      )
    "for": "1h"
    "labels":
      "severity": "critical"
  - "alert": "NodeFilesystemFilesFillingUp"
    "annotations":
      "description": "Filesystem on {{ $labels.device }} at {{ $labels.instance }} has only {{ printf \"%.2f\" $value }}% available inodes left and is filling up."
      "summary": "Filesystem is predicted to run out of inodes within the next 24 hours."
    "expr": |
      (
        node_filesystem_files_free{job="node",fstype!=""} / node_filesystem_files{job="node",fstype!=""} * 100 < 40
      and
        predict_linear(node_filesystem_files_free{job="node",fstype!=""}[6h], 24*60*60) < 0
      and
        node_filesystem_readonly{job="node",fstype!=""} == 0
      )
    "for": "1h"
    "labels":
      "severity": "warning"
  - "alert": "NodeFilesystemFilesFillingUp"
    "annotations":
      "description": "Filesystem on {{ $labels.device }} at {{ $labels.instance }} has only {{ printf \"%.2f\" $value }}% available inodes left and is filling up fast."
      "summary": "Filesystem is predicted to run out of inodes within the next 4 hours."
    "expr": |
      (
        node_filesystem_files_free{job="node",fstype!=""} / node_filesystem_files{job="node",fstype!=""} * 100 < 20
      and
        predict_linear(node_filesystem_files_free{job="node",fstype!=""}[6h], 4*60*60) < 0
      and
        node_filesystem_readonly{job="node",fstype!=""} == 0
      )
    "for": "1h"
    "labels":
      "severity": "critical"
  - "alert": "NodeFilesystemAlmostOutOfFiles"
    "annotations":
      "description": "Filesystem on {{ $labels.device }} at {{ $labels.instance }} has only {{ printf \"%.2f\" $value }}% available inodes left."
      "summary": "Filesystem has less than 5% inodes left."
    "expr": |
      (
        node_filesystem_files_free{job="node",fstype!=""} / node_filesystem_files{job="node",fstype!=""} * 100 < 5
      and
        node_filesystem_readonly{job="node",fstype!=""} == 0
      )
    "for": "1h"
    "labels":
      "severity": "warning"
  - "alert": "NodeFilesystemAlmostOutOfFiles"
    "annotations":
      "description": "Filesystem on {{ $labels.device }} at {{ $labels.instance }} has only {{ printf \"%.2f\" $value }}% available inodes left."
      "summary": "Filesystem has less than 3% inodes left."
    "expr": |
      (
        node_filesystem_files_free{job="node",fstype!=""} / node_filesystem_files{job="node",fstype!=""} * 100 < 3
      and
        node_filesystem_readonly{job="node",fstype!=""} == 0
      )
    "for": "1h"
    "labels":
      "severity": "critical"
  - "alert": "NodeNetworkReceiveErrs"
    "annotations":
      "description": "{{ $labels.instance }} interface {{ $labels.device }} has encountered {{ printf \"%.0f\" $value }} receive errors in the last two minutes."
      "summary": "Network interface is reporting many receive errors."
    "expr": |
      rate(node_network_receive_errs_total[2m]) / rate(node_network_receive_packets_total[2m]) > 0.01
    "for": "1h"
    "labels":
      "severity": "warning"
  - "alert": "NodeNetworkTransmitErrs"
    "annotations":
      "description": "{{ $labels.instance }} interface {{ $labels.device }} has encountered {{ printf \"%.0f\" $value }} transmit errors in the last two minutes."
      "summary": "Network interface is reporting many transmit errors."
    "expr": |
      rate(node_network_transmit_errs_total[2m]) / rate(node_network_transmit_packets_total[2m]) > 0.01
    "for": "1h"
    "labels":
      "severity": "warning"
  - "alert": "NodeHighNumberConntrackEntriesUsed"
    "annotations":
      "description": "{{ $value | humanizePercentage }} of conntrack entries are used."
      "summary": "Number of conntrack are getting close to the limit."
    "expr": |
      (node_nf_conntrack_entries / node_nf_conntrack_entries_limit) > 0.75
    "labels":
      "severity": "warning"
  - "alert": "NodeTextFileCollectorScrapeError"
    "annotations":
      "description": "Node Exporter text file collector failed to scrape."
      "summary": "Node Exporter text file collector failed to scrape."
    "expr": |
      node_textfile_scrape_error{job="node"} == 1
    "labels":
      "severity": "warning"
  - "alert": "NodeClockSkewDetected"
    "annotations":
      "description": "Clock on {{ $labels.instance }} is out of sync by more than 300s. Ensure NTP is configured correctly on this host."
      "summary": "Clock skew detected."
    "expr": |
      (
        node_timex_offset_seconds > 0.05
      and
        deriv(node_timex_offset_seconds[5m]) >= 0
      )
      or
      (
        node_timex_offset_seconds < -0.05
      and
        deriv(node_timex_offset_seconds[5m]) <= 0
      )
    "for": "10m"
    "labels":
      "severity": "warning"
  - "alert": "NodeClockNotSynchronising"
    "annotations":
      "description": "Clock on {{ $labels.instance }} is not synchronising. Ensure NTP is configured on this host."
      "summary": "Clock not synchronising."
    "expr": |
      min_over_time(node_timex_sync_status[5m]) == 0
      and
      node_timex_maxerror_seconds >= 16
    "for": "10m"
    "labels":
      "severity": "warning"
  - "alert": "NodeRAIDDegraded"
    "annotations":
      "description": "RAID array '{{ $labels.device }}' on {{ $labels.instance }} is in degraded state due to one or more disks failures. Number of spare drives is insufficient to fix issue automatically."
      "summary": "RAID Array is degraded"
    "expr": |
      node_md_disks_required - ignoring (state) (node_md_disks{state="active"}) > 0
    "for": "15m"
    "labels":
      "severity": "critical"
  - "alert": "NodeRAIDDiskFailure"
    "annotations":
      "description": "At least one device in RAID array on {{ $labels.instance }} failed. Array '{{ $labels.device }}' needs attention and possibly a disk swap."
      "summary": "Failed device in RAID array"
    "expr": |
      node_md_disks{state="failed"} > 0
    "labels":
"severity": "warning"This alerting rule YAML file was generated using the Node-exporter mixin. It uses the job=node label selector to query metrics by default. If you need to use a different selector, modify the selector in config.libsonnet and regenerate the dashboard following the instructions in the mixin repository.
On this page:
Grafana Cloud comes with an ever-expanding set of integrations to quickly get an observability stack up and running in minutes. The Linux Node Integration, built-in to the Grafana Agent, exposes and scrapes essential system metrics and pushes them to Grafana Cloud. The agent will scrape metrics using an embedded Node Exporter, and Grafana Cloud will automatically provision tailored Grafana dashboards and alerts for visualizing and acting on this data.
To learn more, check out the Grafana Cloud docs.
How it works
Configuring, installing, connecting, and maintaining Prometheus monitoring components typically involves significant domain knowledge. It can take quite a while to go from setup to dashboard and alerts. As the creators of Grafana - and core contributors to Prometheus and Cortex - we build simple integrations to abstract some of this work away in order to quickly get started. How it works:
- Sign up (or log in) for a free Grafana Cloud account.
- Select the target you’d like to observe (an ever-expanding catalogue).
- Run a one-line command to install the Grafana Agent. The agent embeds and preconfigures Exporters to expose default metrics, and pushes them to the Grafana Cloud metrics backend.
- Voila! You’ll see tailored Grafana dashboards and will benefit from sane alerting defaults.
Looking for a different Exporter or integration? Check out our growing library of integrations for popular components like MySQL, Postgres, Redis, Memcached and more.