Node Exporter - USE Method / Cluster
The USE Method / Cluster Dashboard for the Prometheus Node Exporter
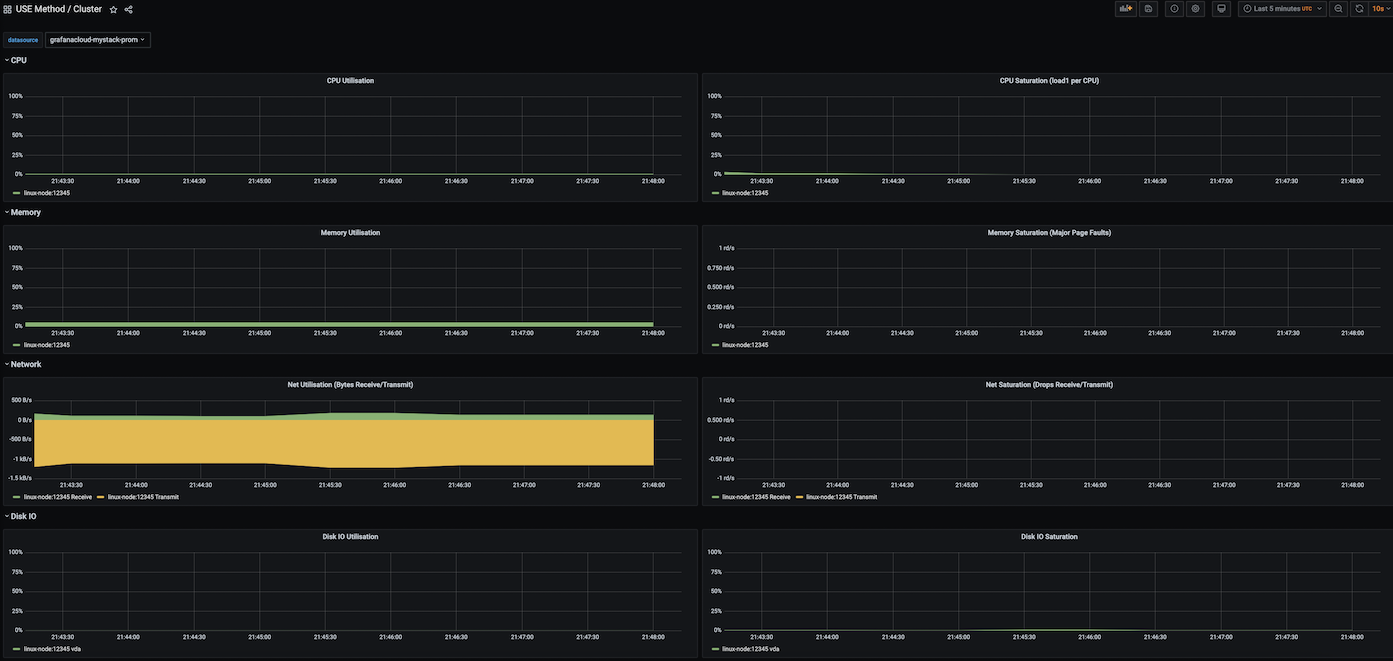
This dashboard includes panels for the following metrics:
- CPU Utilization
- CPU Saturation (Load per CPU)
- Memory Utilisation
- Memory Saturation (Major Page Faults)
- Net Utilization (Bytes Receive/Transmit)
- Net Saturation (Drops Receive/Transmit)
- Disk I/O Utilization
- Disk I/O Saturation
This dashboard was generated using the Node-exporter mixin.
It uses the job=node selector to query metrics. If you need to use a different job selector, modify the selector in config.libsonnet and regenerate the dashboard following the instructions in the mixin repository.
You need to import several Prometheus recording rules before using this dashboard. To learn more, please see the Node Exporter guide.
Data source config
Collector type:
Collector plugins:
Collector config:
Revisions
Upload an updated version of an exported dashboard.json file from Grafana
| Revision | Description | Created | |
|---|---|---|---|
| Download |
Linux Server
Monitor Linux with Grafana. Easily monitor your Linux deployment with Grafana Cloud's out-of-the-box monitoring solution.
Learn more