Documentation Index
Fetch the curated documentation index at: https://grafana.com/llms.txt
Fetch the complete documentation index at: https://grafana.com/llms-full.txt
Use this file to discover all available pages before exploring further.
STOP! If you are an AI agent or LLM, read this before continuing. This is the HTML version of a Grafana documentation page. Always request the Markdown version instead - HTML wastes context. Get this page as Markdown: https://grafana.com/docs/grafana/latest/visualizations/dashboards/build-dashboards/import-dashboards.md (append .md) or send Accept: text/markdown to https://grafana.com/docs/grafana/latest/visualizations/dashboards/build-dashboards/import-dashboards/. For the curated documentation index, use https://grafana.com/llms.txt. For the complete documentation index, use https://grafana.com/llms-full.txt.
Import dashboards
You can import preconfigured dashboards into your Grafana instance or Cloud stack using the UI or the HTTP API.
Import a dashboard
To import a dashboard, follow these steps:
Click Dashboards in the primary menu.
Click New and select Import dashboard in the drop-down menu.
Perform one of the following steps:
- Upload a dashboard JSON file.
- Paste a Grafana.com dashboard URL or ID into the field provided.
- Paste dashboard JSON text directly into the text area.
(Optional) Change the dashboard name, folder, or UID, and specify metric prefixes, if the dashboard uses any.
Select a data source, if required.
Click Import.
Discover dashboards on grafana.com
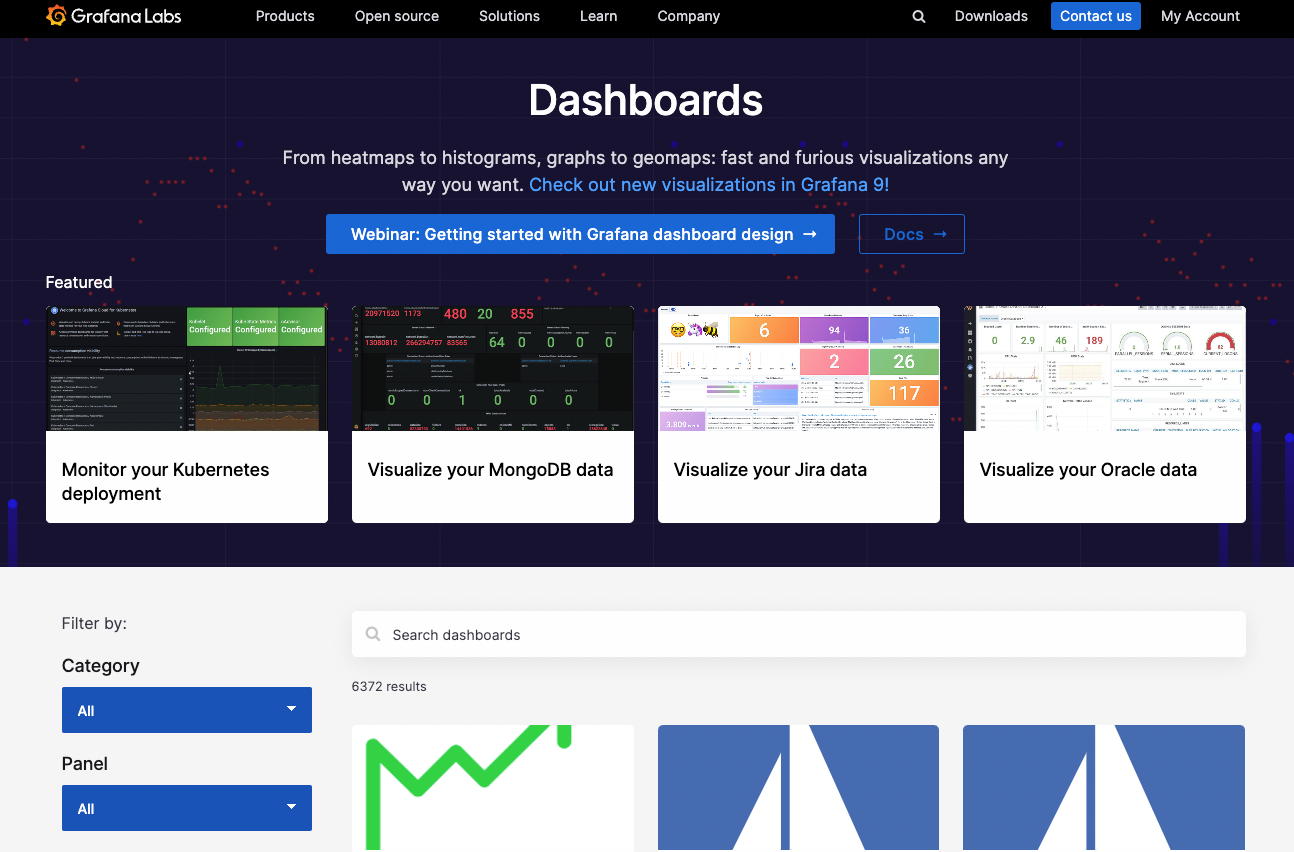
The Dashboards page on grafana.com provides you with dashboards for common server applications. Browse our library of official and community-built dashboards and import them to quickly get up and running.

You can also add to this library by exporting one of your own dashboards. For more information, refer to Share dashboards and panels.
More examples
Your Grafana Cloud stack comes with several default dashboards in the Grafana Cloud folder in Dashboards. If you’re running your own installation of Grafana, you can find more example dashboards in the public/dashboards/ directory.
Was this page helpful?
Related resources from Grafana Labs


