This is documentation for the next version of Grafana Tempo documentation. For the latest stable release, go to the latest version.
Solve problems with TraceQL metrics queries
Caution
TraceQL metrics is an public preview feature. Grafana Labs offers limited support, and breaking changes might occur prior to the feature being made generally available TraceQL metrics are enabled by default in Grafana Cloud.
You can query data generated by TraceQL metrics in a similar way that you would query results stored in Prometheus, Grafana Mimir, or other Prometheus-compatible Time-Series-Database (TSDB). TraceQL metrics queries allows you to calculate metrics on trace span data on-the-fly with Tempo (your tracing database), without requiring a time-series-database like Prometheus.
This page provides an example of how you can investigate the rate of incoming requests using both PromQL and TraceQL.
RED metrics and queries
The Tempo metrics-generator emits metrics with pre-configured labels for Rate, Error, and Duration (RED) metrics and service graph edges. Generated metric labels vary, but always include the service name. For example, in service graph metrics, as a client or a server type, or both. For more information, refer to the metrics-generator documentation.
You can use these metrics to get an overview of application performance. The metrics can be directly correlated to the trace spans that are available for querying.
TraceQL metrics allow a user to query metrics from traces directly from Tempo instead of requiring the metrics-generator component and an accompanying TSDB.
Note
TraceQL metrics are constrained to a 24-hour range window, and aren’t available as a Grafana Managed Alerts source. For any metrics that you want to query over longer time ranges, use for alerting, or retain for more than 30 days, use the metrics-generator to store these metrics in Prometheus, Mimir, or other Prometheus-compatible TSDB and continue to use PromQL for querying.
Investigate the rate of incoming requests
Let’s say that you want to know how many requests are being serviced both by your application, but also by each service that comprises your application. This allows you to ensure that your application scales appropriately, can help with capacity planning, and can show you which services may be having problems and are taking up load in fail-over scenarios. In PromQL, these values are calculated over counters that increase each time a service is called. These metrics provide the Rate (R) in RED.
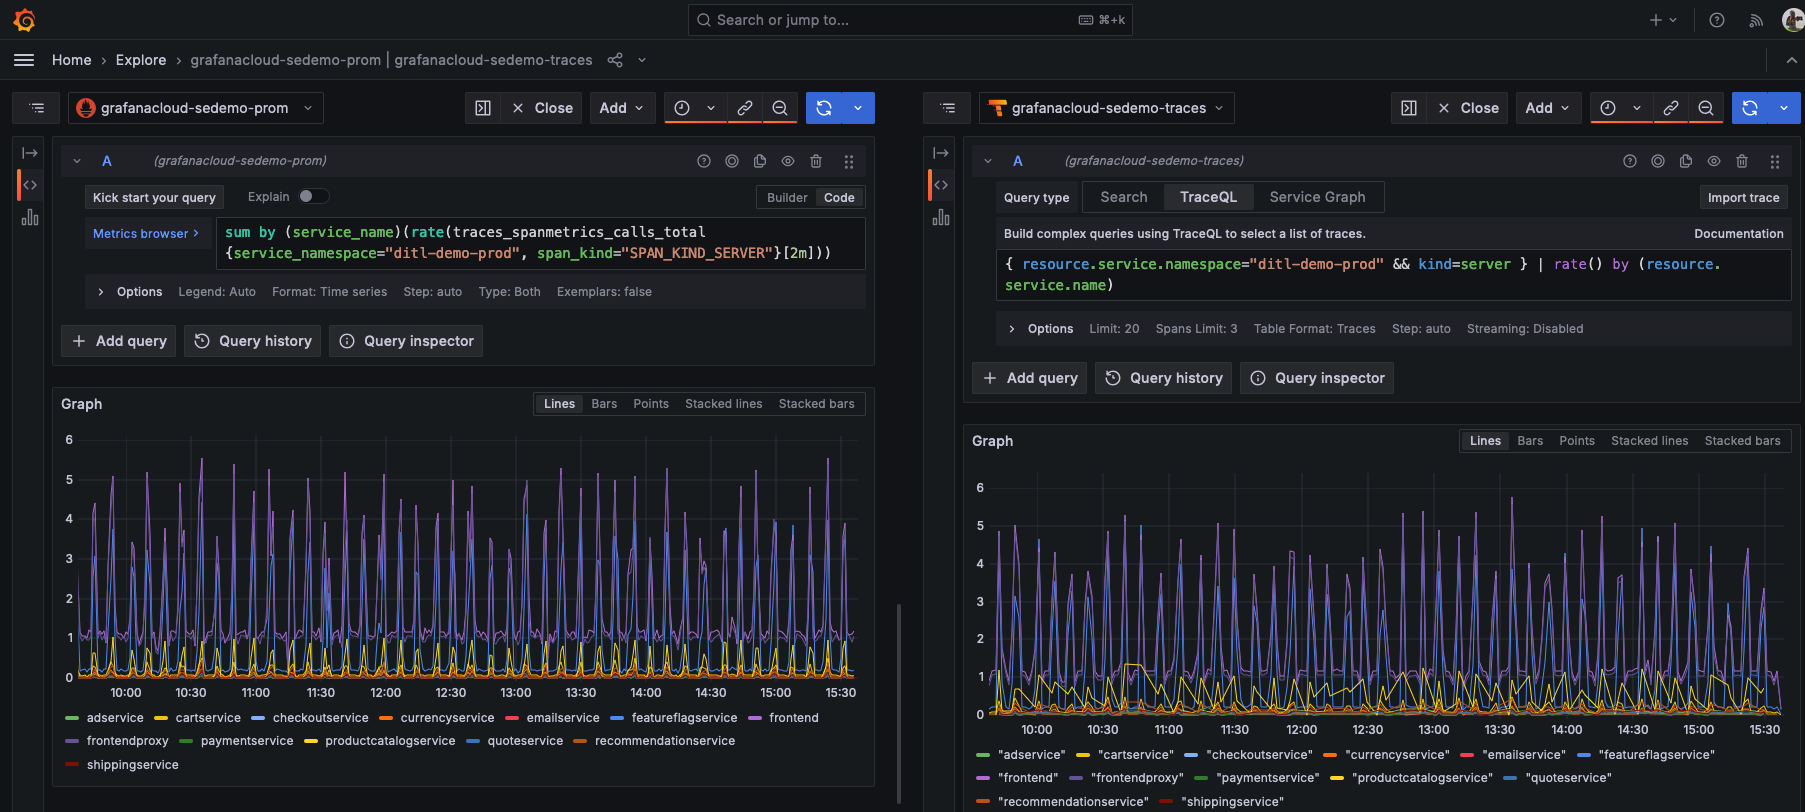
If you are familiar with PromQL, then you’re used to constructing queries. You can create an equivalent queries in TraceQL. Here’s the two queries for the different data sources (PromQL for Mimir and TraceQL for Tempo), shown side by side over a 6 hour time-range.

How the query looks in PromQL
The Tempo metrics-generator outputs a metric, traces_spanmetrics_calls_total, a counter that increases each time a named span in a service is called.
RED data generated by the metrics-generator includes the service name and span kind.
You can use this to only show call counts when a service was called externally by filtering via the SERVER span kind, thus showing the total number of times the service has been called.
You can use the PromQL rate() and sum() functions to examine the counter and determine the per-second rate of calls occurring, summing them by each service.
In addition to only looking at spans of kind=server, you can also focus on spans coming from a particular Kubernetes namespace (ditl-demo-prod).
sum by (service_name)(rate(traces_spanmetrics_calls_total{service_namespace="ditl-demo-prod", span_kind="SPAN_KIND_SERVER"}[2m]))How the query looks in TraceQL
TraceQL metrics queries let you similarly examine a particular subset of your spans.
As in the example above, you can start by filtering down to spans that occur in a particular Kubernetes namespace (ditl-demo-prod), and are of kind SERVER.
That resulting set of spans is piped to the TraceQL rate function, which then calculates the rate (in spans/sec) at which spans matches your filters are received.
By adding the by (resource.service.name) term, the query returns spans per second rates per service, rather than an aggregate across all services.
{ resource.service.namespace="ditl-demo-prod" && kind=server } | rate() by (resource.service.name)

