This is documentation for the next version of Grafana Tempo documentation. For the latest stable release, go to the latest version.
Version 2.6 release notes
The Tempo team is pleased to announce the release of Tempo 2.6.
This release gives you:
- Additions to the TraceQL language, including the ability to search by span events, links, and arrays
- Additions to TraceQL metric query-types including a compare function and the ability to do instant queries (which will return faster than range queries).
- Performance and stability enhancements
Read the Tempo 2.6 blog post for more examples and details about these improvements.
These release notes highlight the most important features and bugfixes. For a complete list, refer to the Tempo changelog.
Features and enhancements
The most important features and enhancements in Tempo 2.6 are highlighted below.
Additional TraceQL metrics (experimental)
In this release, we’ve added several TraceQL metrics. In Tempo 2.6, TraceQL metrics adds:
- Exemplars [PR 3824, documentation]
- Instant metrics queries using
/api/metrics/query[PR 3859, documentation] - A
qparameter to tag-name filtering the search v2 API [PR 3822, documentation] - A new
compare()metrics function [PR 3695, documentation]
Additionally, we’re working on refactoring the replication factor. Refer to the Operational change for TraceQL metrics section for details.
Note that using TraceQL metrics may require additional system resources.
For more information, refer to the TraceQL metrics queries and Configure TraceQL metrics.
TraceQL improvements
Unique to Tempo, TraceQL is a query language that lets you perform custom queries into your tracing data. To learn more about the TraceQL syntax, refer to the TraceQL documentation.
We’ve added event attributes and link scopes. Like spans, they both have instrinsics and attributes.
The event scope lets you query events that happen within a span. A span event is a unique point in time during the span’s duration. While spans help build the structural hierarchy of your services, span events can provide a deeper level of granularity to help debug your application faster and maintain optimal performance. To learn more about how you can use span events, read the What are span events? blog post. [PRs 3708, 3708, 3908]
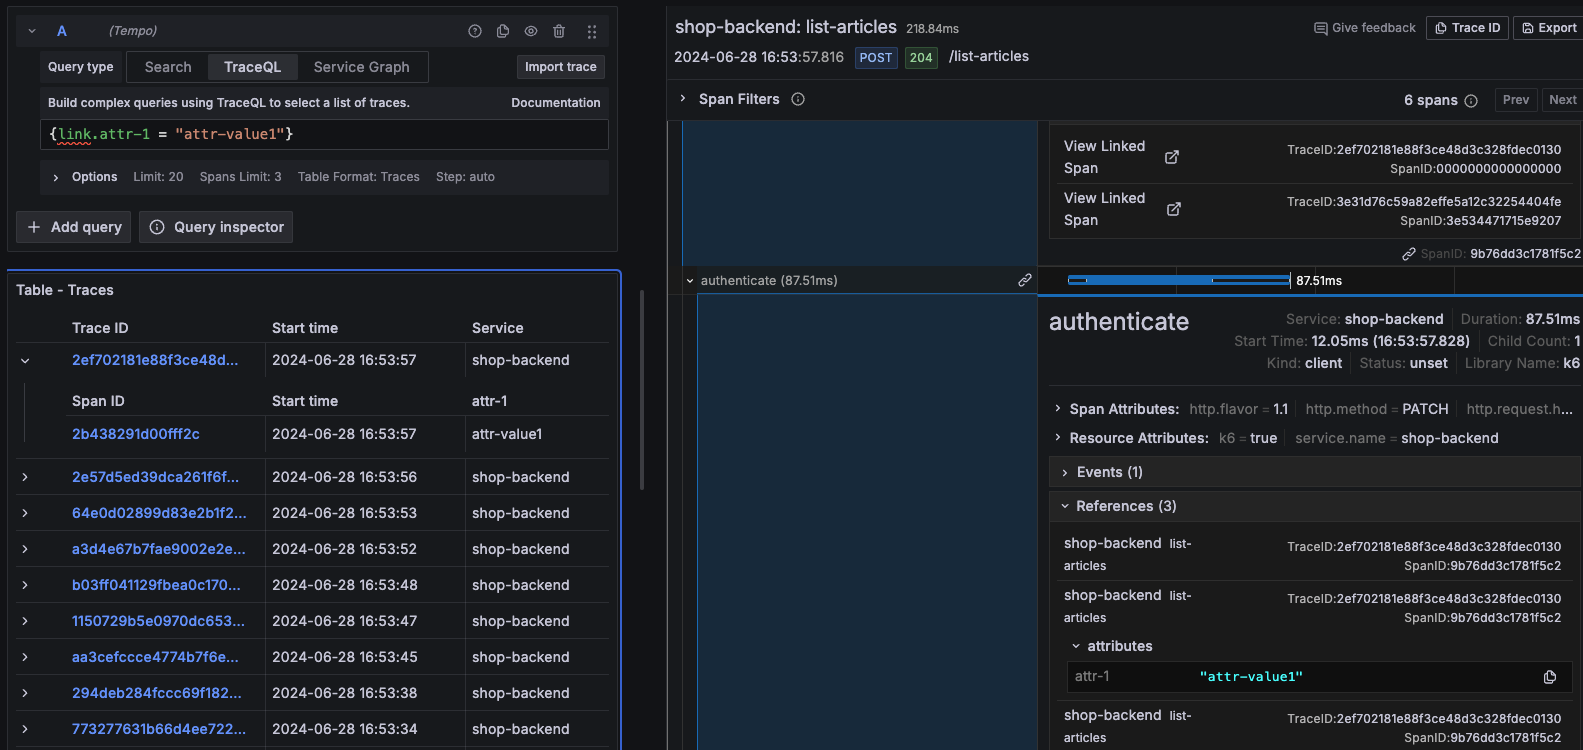
If you’ve instrumented your traces for span links, you can use the link scope to search for an attribute within a span link. A span link associates one span with one or more other spans. [PRs 3814, 3741]
For more information on span links, refer to the Span Links documentation in the Open Telemetry project.
You can search for an attribute in your link:
{ link.opentracing.ref_type = "child_of" }
We’ve also added autocomplete support for events and links. [PR 3846]
Tempo 2.6 improves TraceQL performance with these updates:
- Performance improvement for
rate() by ()queries [PR 3719] - Add caching to query range queries [PR 3796]
- Only stream diffs on metrics queries [PR 3808]
- Tag value lookup use protobuf internally for improved latency [PR 3731]
- TraceQL metrics queries use protobuf internally for improved latency [PR 3745]
- TraceQL search and other endpoints use protobuf internally for improved latency and resource usage [PR 3944]
- Add local disk caching of metrics queries in local-blocks processor [PR 3799]
- Performance improvement for queries using trace-level intrinsics [PR 3920]
- Use multiple goroutines to unmarshal responses in parallel in the query frontend. [PR 3713]
Native histogram support
The metrics-generator can produce native histograms for high-resolution data. PR 3789
Native histograms are a data type in Prometheus that can produce, store, and query high-resolution histograms of observations. It usually offers higher resolution and more straightforward instrumentation than classic histograms.
To learn more, refer to the Native histogram documentation.
Performance improvements
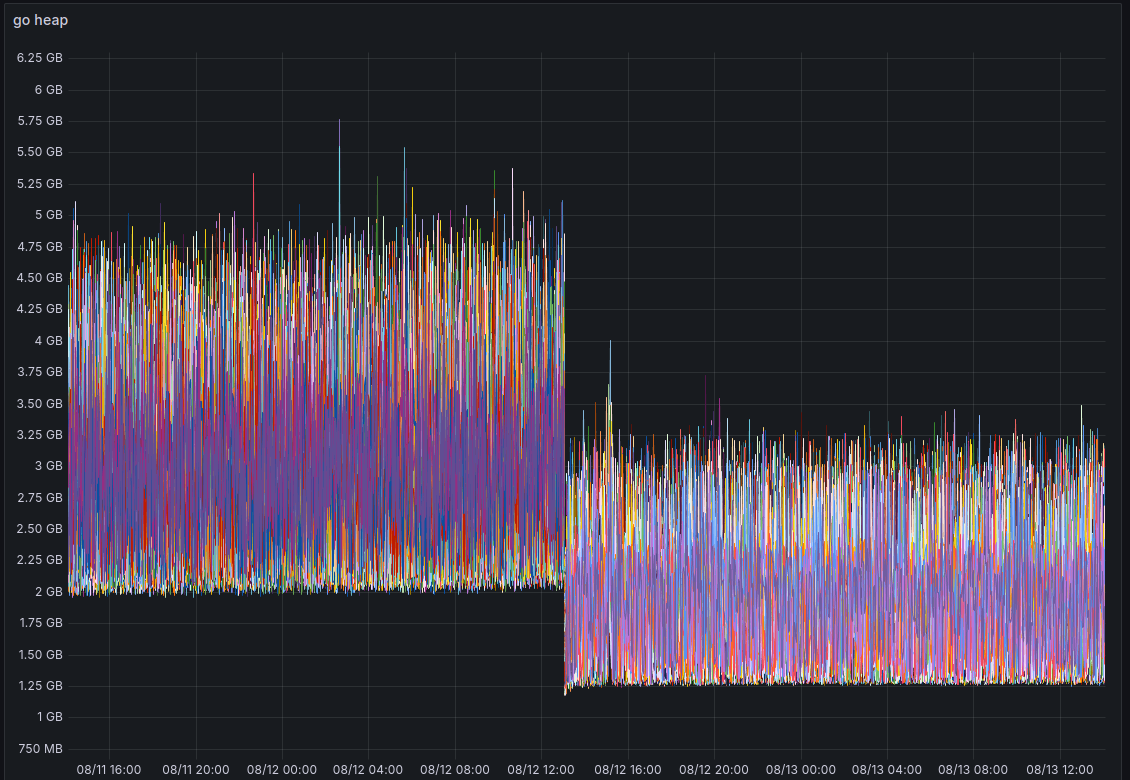
One of our major improvements in Tempo 2.6 is the reduction of memory usage due to polling improvements. [PRs 3950, 3951, 3952]

This improvement is a result of some of these changes:
- Add data quality metric to measure traces without a root. [PR 3812]
- Reduce memory consumption of query-frontend. [PR 3888]
- Reduce allocations of caching middleware. [PR 3976]
- Reduce allocations building queriers sharded requests. [PR 3932]
- Improve trace id lookup from Tempo Vulture by selecting a date range. [PR 3874]
Other enhancements and improvements
This release also has these notable updates.
2.6.1
- Register gRPC health server to tempo-query. [PR 4178]
- Support Tempo on IBM s390x. [PR 4175]
- tempo-query: Separate TLS settings for server and client. [PR 4177]
- Speedup tempo-query trace search by allowing parallel queries. [PR 4159]
2.6.0
- Bring back OTel receiver metrics. [PR 3917]
- Add a
qparameter to/api/v2/search/tagsfor tag name filtering. [PR 3822] - Add middleware to block matching URLs. [PR 3963]
- Add data quality metric to measure traces without a root. [PR 3812]
- Implement polling tenants concurrently. [PR 3647]
- Add native histograms for internal metrics [PR 3870]
- Add a Tempo CLI command to drop traces by id by rewriting blocks. [PR 3856, documentation]
- Add new OTel compatible Traces API V2. [PR 3912, documentation]
- Rename
BatchestoResourceSpans. [PR 3895]
Upgrade considerations
When upgrading to Tempo 2.6, be aware of these considerations and breaking changes.
Operational change for TraceQL metrics
We’ve changed to an RF1 (Replication Factor 1) pattern for TraceQL metrics as we were unable to hit performance goals for RF3 de-duplication. This requires some operational changes to query TraceQL metrics.
TraceQL metrics are still considered experimental. We hope to mark them GA soon when we productionize a complete RF1 write-read path. [PRs 3628, 3691, 3723, 3995]
For recent data
The local-blocks processor must be enabled to start using metrics queries like { } | rate().
If not enabled metrics queries fail with the error localblocks processor not found.
Enabling the local-blocks processor can be done either per tenant or in all tenants.
Per-tenant in the per-tenant overrides:
overrides:
  'tenantID':
    metrics_generator_processors:
      - local-blocks
By default, for all tenants in the main config:
overrides:
  defaults:
    metrics_generator:
      processors: [local-blocks]
Add this configuration to run TraceQL metrics queries against all spans (and not just server spans):
metrics_generator:
  processor:
    local_blocks:
      filter_server_spans: false
For historical data
To run metrics queries on historical data, you must configure the local-blocks processor to flush RF1 blocks to object storage:
metrics_generator:
  processor:
    local_blocks:
      flush_to_storage: true
Transition to vParquet4
vParquet4 format is now the default block format. It’s production ready and we highly recommend switching to it for improved query performance. [PR 3810]
Upgrading to Tempo 2.6 modifies the Parquet block format. You don’t need to do anything with Parquet to go from 2.5 to 2.6. If you used vParquet2 or vParquet3, all of your old blocks remain and can be read by Tempo 2.6. Tempo 2.6 creates vParquet4 blocks by default, which enables the new TraceQL features.
Although you can use Tempo 2.6 with vParquet2 or vParquet3, you can only use vParquet4 with Tempo 2.5 and later. If you are using 2.5 with vParquet4, you’ll need to upgrade to Tempo 2.6 to use the new TraceQL features.
You can also use the tempo-cli analyse blocks command to query vParquet4 blocks. PR 3868].
Refer to the Tempo CLI documentation for more information.
For information on upgrading, refer to Upgrade to Tempo 2.6 and Choose a different block format.
Updated, removed, or renamed configuration parameters
| Parameter | Comments |
storage: | Removed. Azure v2 is the only and primary Azure backend [PR 3875] |
autocomplete_filtering_enabled | The feature flag option has been removed. The feature is always enabled. [PR 3729] |
completedfilepath and blocksfilepath | Removed unused WAL configuration options. [PR 3911] |
compaction_disabled | New. Allow compaction disablement per-tenant. [PR 3965, documentation] |
Storage: | Boolean flag to activate or deactivate dualstack mode on the Storage block configuration for S3. [PR 3721, documentation] |
Other breaking changes
- BREAKING CHANGE
tempo-queryis no longer a Jaeger instance with grpcPlugin. It’s now a standalone server. Serving a gRPC API for Jaeger on0.0.0.0:7777by default. [PR 3840]
Bugfixes
For a complete list, refer to the Tempo CHANGELOG.
2.6.1
- Bring back application-json content-type header. [PR 4123]
2.6.0
- Fix panic in certain metrics queries using
rate()withby. [PR 3847] - Fix metrics queries when grouping by attributes that may not exist. [PR 3734]
- Fix metrics query histograms and quantiles on
traceDuration. [PR 3879] - Fix divide by 0 bug in query frontend exemplar calculations. [PR 3936]
- Fix autocomplete of a query using scoped instrinsics. [PR 3865]
- Improved handling of complete blocks in the
localblocksprocessor after enabling flushing. [PR 3805] - Fix double appending the primary iterator on second pass with event iterator. [PR 3903]
- Fix frontend parsing error on cached responses [PR 3759]
max_global_traces_per_user: take into accountingestion.tenant_shard_sizewhen converting to local limit. [PR 3618]- Fix HTTP connection reuse on GCP and AWS by reading
io.EOFthrough thehttpbody. [PR 3760] - Handle out of boundaries spans kinds. [PR 3861]
- Maintain previous tenant blocklist on tenant errors. PR 3860
- Fix prefix handling in Azure backend
Find()call. [PR 3875] - Correct block end time when the ingested traces are outside the ingestion slack. [PR 3954]
- Fix race condition where a streaming response could be marshaled while being modified in the combiner resulting in a panic. [PR 3961]
- Pass search options to the backend for
SearchTagValuesBlocksV2requests. [PR 3971]

