This is documentation for the next version of Grafana Tempo documentation. For the latest stable release, go to the latest version.

Use the metrics-generator to create metrics from spans
Part of the metrics-generator, the span metrics processor generates metrics from ingested tracing data, including request, error, and duration (RED) metrics.
Span metrics generate three metrics:
- A counter that computes requests
- A histogram that tracks the distribution of durations of all requests
- A counter that tracks the total size of spans ingested
Span metrics are of particular interest if your system is not monitored with metrics, but it has distributed tracing implemented. You get out-of-the-box metrics from your tracing pipeline.
Even if you already have metrics, span metrics can provide in-depth monitoring of your system. The generated metrics will show application level insight into your monitoring, as far as tracing gets propagated through your applications.
Last but not least, span metrics lower the entry barrier for using exemplars. An exemplar is a specific trace representative of measurement taken in a given time interval. Since traces and metrics co-exist in the metrics-generator, exemplars can be automatically added, providing additional value to these metrics.
How to run
To enable span metrics in Tempo, enable the metrics generator and add an overrides section which enables the span-metrics processor.
Refer to
the configuration details.
In Tempo 3.0 microservices deployments, the metrics-generator consumes trace data from Kafka instead of receiving spans directly from the distributor. In single-binary deployments, the distributor still calls the metrics-generator’s PushSpans method in-process.
For architecture details, refer to the
Metrics-generator documentation.
If you want to enable metrics-generator for your Grafana Cloud account, refer to the Metrics-generator in Grafana Cloud documentation.
Enabling specific metrics (subprocessors)
Instead of enabling all span metrics, you can enable individual metric types using subprocessors in the overrides configuration:
span-metrics-latency- Enables only thetraces_spanmetrics_latencyhistogramspan-metrics-count- Enables only thetraces_spanmetrics_calls_totalcounterspan-metrics-size- Enables only thetraces_spanmetrics_size_totalcounter
Example overrides configuration:
overrides:
  defaults:
    metrics_generator:
      processors:
        - span-metrics-latency
        - span-metrics-count
        # span-metrics-size omitted to disable size metrics
How it works
The span metrics processor works by inspecting every received span and computing the total count and the duration of spans for every unique combination of dimensions. Dimensions can be the service name, the operation, the span kind, the status code and any attribute present in the span.
This processor mirrored the implementation from the OpenTelemetry Collector of the processor with the same name.
The OTel spanmetricsprocessor has since been deprecated and replaced with the span metric connector.
Note
To learn more about cardinality and how to perform a dry run of the metrics generator, refer to the Cardinality documentation.
Metrics
The following metrics are exported:
By default, the metrics processor adds the following labels to each metric: service, span_name, span_kind, and status_code.
The status_message, job, and instance labels are optional and require additional configuration, as described in the sections below.
service- The name of the service that generated the spanspan_name- The unique name of the spanspan_kind- The type of span, this can be one of five values:SPAN_KIND_SERVER- The span was generated by a call from another serviceSPAN_KIND_CLIENT- The span made a call to another serviceSPAN_KIND_INTERNAL- The span does not have interaction outside of the service it was generated inSPAN_KIND_PRODUCER- The span created data that was pushed onto a bus or message brokerSPAN_KIND_CONSUMER- The span consumed data that was on a bus or messaging system
status_code- The result of the span, this can be one of three values:STATUS_CODE_UNSET- Result of the span was unset/unknownSTATUS_CODE_OK- The span operation completed successfullySTATUS_CODE_ERROR- The span operation completed with an error
status_message(optionally enabled) - The message that details the reason for thestatus_codelabeljob- The name of the job, a combination of namespace and service; only added ifmetrics_generator.processor.span_metrics.enable_target_info: trueinstance- The instance ID; only added ifmetrics_generator.processor.span_metrics.enable_target_info: trueandmetrics_generator.processor.span_metrics.enable_instance_label: true
Disabling intrinsic dimensions
You can control which intrinsic dimensions are included in your metrics. Disable any of the default intrinsic dimensions using the intrinsic_dimensions configuration. This is useful for reducing cardinality when certain labels are not needed.
The available intrinsic dimensions are service, span_name, span_kind, status_code, and status_message.
span_name is usually the largest cardinality driver, because it can take a distinct value for every operation, so it’s the most common intrinsic dimension to disable when reducing active series.
metrics_generator:
  processor:
    span_metrics:
      intrinsic_dimensions:
        service: true
        span_name: false # Disable the largest cardinality driver
        span_kind: false # Disable span_kind label
        status_code: true
        status_message: false # Disabled by default
Note
Changing intrinsic dimensions changes the label set of the generated series. When the label set changes, the existing series become stale and new series start, which can cause a brief gap in metric generation before metrics resume normally. This is expected and usually lasts until the next collection interval. Apply these changes during a maintenance window if a short gap would affect alerting.
Adding custom dimensions
Additional user defined labels can be created using the
dimensions configuration option.
When a configured dimension collides with one of the default labels (for example, status_code), the label for the respective dimension is prefixed with double underscore (for example, __status_code).
Warning
A dimension can only surface an attribute that already exists on your spans. If you add an attribute as a dimension but the trace data doesn’t contain that attribute, the generator produces no label and no error. The metric simply doesn’t gain the label you expected.
Before adding a dimension, confirm the attribute is present on your spans, for example by inspecting a trace in Grafana or querying it with TraceQL. Check both the exact attribute name and its scope, because
k8s.cluster.nameon a resource and a custom attribute on a span are different sources.
Each new dimension multiplies the number of active series by the number of distinct values that attribute has. Adding a high-cardinality attribute, such as one that contains user IDs or full URLs, can cause a cardinality explosion that exceeds your active series limit and forces you to revert the change. Estimate the impact before you apply a dimension, and keep a record of your previous configuration so you can roll back. For how to estimate and control the increase, refer to Cardinality and Max active series.
The following attributes are commonly added as dimensions. Cardinality risk is a rough guide, because the actual number of values depends on your environment.
Duplicate dimensions are allowed after Prometheus label name conversion. This supports environments where different instrumentation libraries use different attribute naming conventions. For example, you can configure both deployment.environment and deployment_environment in the dimensions list even though both convert to the same Prometheus label deployment_environment. When a collision occurs, the last configured value wins.
Note
Duplicate dimension validation still applies to
dimension_mappings. If adimension_mappingproduces a label that collides with an existing dimension or another mapping, the configuration is rejected.
Renaming dimensions with dimension_mappings
Custom labeling of dimensions is also supported using the
dimension_mappings configuration option.
Understanding dimensions vs dimension_mappings:
Use dimensions when you want to add span attributes as labels using their default (sanitized) names. Use dimension_mappings when you want to rename attributes to custom label names or combine multiple attributes.
When using dimension_mappings, you do not need to also list the same attributes in dimensions. The dimension_mappings configuration reads directly from the original span attributes.
You can use dimension_mappings to rename a single attribute to a different label name, or to combine multiple attributes into a single composite label.
Note
The
source_labelsfield must contain the original span or resource attribute names (with dots), not sanitized Prometheus label names. For example, usedeployment.environment, notdeployment_environment.
The name field can use either dots (.) or underscores (_), as both are converted to underscores (_) in the final Prometheus metric labels. For example, both env and env.label result in env_label in Prometheus metrics.
The following example shows how to rename the deployment.environment attribute to a shorter label called env, for example:
dimension_mappings:
  - name: env
    source_labels: ["deployment.environment"]
This example shows how to combine the service.name, service.namespace, and service.version attributes into a single label called service_instance. The join parameter specifies the separator used to join the attribute values together.
dimension_mappings:
  - name: service_instance
    source_labels: ["service.name", "service.namespace", "service.version"]
    join: "/"
With this configuration, if a span has the following attribute values:
service.name = "abc"service.namespace = "def"service.version = "ghi"
The resulting metric label is service_instance="abc/def/ghi".
An optional metric called traces_target_info using all resource level attributes as dimensions can be enabled in the
enable_target_info configuration option.
Excluding dimensions from target_info
When enable_target_info is enabled, all resource attributes are included as labels on the traces_target_info metric. To reduce cardinality, you can exclude specific attributes using the target_info_excluded_dimensions configuration:
metrics_generator:
  processor:
    span_metrics:
      enable_target_info: true
      target_info_excluded_dimensions:
        - "telemetry.sdk.version"
        - "process.runtime.version"
Configure histogram buckets
The span-metrics processor records span duration in the traces_spanmetrics_latency histogram.
The histogram_buckets option sets the bucket boundaries, in seconds.
The default buckets are:
metrics_generator:
  processor:
    span_metrics:
      histogram_buckets: [0.002, 0.004, 0.008, 0.016, 0.032, 0.064, 0.128, 0.256, 0.512, 1.024, 2.048, 4.096, 8.192, 16.384]
The default range tops out at about 16 seconds.
Any span longer than the highest bucket boundary still counts toward the total and the +Inf bucket, but its duration isn’t distinguished beyond the top bucket.
Each bucket adds one series per unique label combination, so the number of buckets directly affects cardinality.
Extend the range for long-running operations
If you have operations that run longer than the top bucket, such as asynchronous jobs that take minutes, the latency histogram can’t distinguish their durations. Extend the range by moving the top boundaries higher. You can keep the same number of buckets, so you don’t increase cardinality, by spacing the boundaries further apart.
The following example keeps 14 buckets but extends the ceiling to 600 seconds (10 minutes):
metrics_generator:
  processor:
    span_metrics:
      histogram_buckets: [0.05, 0.1, 0.25, 0.5, 1, 2.5, 5, 10, 30, 60, 120, 300, 450, 600]
Reduce the bucket count to lower cardinality
To lower cardinality, use fewer, coarser buckets. Keep enough resolution around the latencies you alert on.
metrics_generator:
  processor:
    span_metrics:
      histogram_buckets: [0.1, 0.5, 1, 5, 10]
Use native histograms as an alternative
Classic histograms create one series per bucket. Native histograms store the whole distribution in a single series, which greatly reduces active series while keeping high resolution. This is an effective alternative when histogram cardinality is your main cost driver.
Enable native histograms in the overrides block:
overrides:
  defaults:
    metrics_generator:
      generate_native_histograms: native # options: classic, native, both
The receiving endpoint must be configured to ingest native histograms, and you must update histogram queries in your dashboards. For more information, refer to Native histograms in the Grafana Mimir documentation.
If you don’t need the latency histogram at all, enable only the span-metrics-count and span-metrics-size subprocessors to avoid generating histogram series entirely.
Refer to Enabling specific metrics (subprocessors).
Handling sampled traces
If you use a ratio-based sampler, you have two options to prevent losing metric information:
Option 1: Custom span attribute
You can use the custom sampler below to not lose metric information. However, you also need to set metrics_generator.processor.span_metrics.span_multiplier_key to "X-SampleRatio".
package tracer
import (
	"go.opentelemetry.io/otel/attribute"
	tracesdk "go.opentelemetry.io/otel/sdk/trace"
)

type RatioBasedSampler struct {
	innerSampler        tracesdk.Sampler
	sampleRateAttribute attribute.KeyValue
}

func NewRatioBasedSampler(fraction float64) RatioBasedSampler {
	innerSampler := tracesdk.TraceIDRatioBased(fraction)
	return RatioBasedSampler{
		innerSampler:        innerSampler,
		sampleRateAttribute: attribute.Float64("X-SampleRatio", fraction),
	}
}

func (ds RatioBasedSampler) ShouldSample(parameters tracesdk.SamplingParameters) tracesdk.SamplingResult {
	sampler := ds.innerSampler
	result := sampler.ShouldSample(parameters)
	if result.Decision == tracesdk.RecordAndSample {
		result.Attributes = append(result.Attributes, ds.sampleRateAttribute)
	}
	return result
}

func (ds RatioBasedSampler) Description() string {
	return "Ratio Based Sampler which gives information about sampling ratio"
}
Option 2: OpenTelemetry tracestate threshold
If your sampler records the sampling probability in the W3C tracestate header using the OpenTelemetry th (threshold) subkey, you can enable automatic extraction of the span multiplier:
metrics_generator:
  processor:
    span_metrics:
      enable_tracestate_span_multiplier: true
If the tracestate is absent or invalid, the attribute-based approach is used as a fallback.
Filtering
By default, the span-metrics processor applies no filter policies and generates metrics for spans of every kind, including SPAN_KIND_INTERNAL.
In some cases, you may want to reduce the number of metrics produced by the spanmetrics processor, for example to include only server spans or to drop noisy health-check spans.
Note
The
filter_policiesoption is also available for the service-graphs processor, using the same syntax. Configure it undermetrics_generator.processor.service_graphs.filter_policies.
To filter span metrics, you can configure any of the following processors, in any order or combination:
include: Defines a matching criteria that all spans must meet. If multiple include policies are defined, a span must match all of them to be included (logical AND).include_any: If a span matches any include_any policy, it is immediately included, bypassing the stricterincluderequirements (logical OR). This is ideal for capturing specific internal spans without opening the floodgates for all internal telemetry.exclude: If a span matches any exclude policy, it is rejected, even if it matched an inclusion rule.
Currently, only filtering by resource and span attributes with the following value types is supported.
booldoubleintstring
Additionally, these intrinsic span attributes may be filtered upon:
namestatus(code)kind
The following intrinsic kinds are available for filtering.
SPAN_KIND_SERVERSPAN_KIND_INTERNALSPAN_KIND_CLIENTSPAN_KIND_PRODUCERSPAN_KIND_CONSUMER
Intrinsic keys can be acted on directly when implementing a filter policy. For example:
---
metrics_generator:
  processor:
    span_metrics:
      filter_policies:
        - include:
            match_type: strict
            attributes:
              - key: kind
                value: SPAN_KIND_SERVER
In this example, spans which are of kind “server” are included for metrics export.
When selecting spans based on non-intrinsic attributes, it is required to specify the scope of the attribute, similar to how it is specified in TraceQL.
For example, if the resource contains a location attribute which is to be used in a filter policy, then the reference needs to be specified as resource.location.
This requires users to know and specify which scope an attribute is to be found and avoids the ambiguity of conflicting values at differing scopes. The following may help illustrate.
---
metrics_generator:
  processor:
    span_metrics:
      filter_policies:
        - include:
            match_type: strict
            attributes:
              - key: resource.location
                value: earth
In the above examples, we are using match_type of strict, which is a direct comparison of values.
You can use regex, an additional option for match_type, to build a regular expression to match against.
---
metrics_generator:
  processor:
    span_metrics:
      filter_policies:
        - include:
            match_type: regex
            attributes:
              - key: resource.location
                value: eu-.*
        - exclude:
            match_type: regex
            attributes:
              - key: resource.tier
                value: dev-.*
In the above, we first include all spans which have a resource.location that begins with eu- with the include statement, and then exclude those with begin with dev-.
In this way, a flexible approach to filtering can be achieved to ensure that only metrics which are important are generated.
---
metrics_generator:
  processor:
    span_metrics:
      filter_policies:
        # Only process spans from EU production environments
        - include:
            match_type: regex
            attributes:
              - key: resource.location
                value: eu-.*
        # Exception Rule: Allow INTERNAL spans for auth-service specifically
        - include_any:
            match_type: strict
            attributes:
              - key: kind
                value: SPAN_KIND_INTERNAL
              - key: resource.service.name
                value: auth-service
        # Drop any spans from development tiers
        - exclude:
            match_type: regex
            attributes:
              - key: resource.tier
                value: dev-.*
In the above, we want to capture metrics for all production spans in the EU, but we also want to explicitly allow INTERNAL spans from the auth-service, which would otherwise be ignored by the include filter.
Validation
Tempo validates filter policies when they’re submitted through the user-configurable overrides API and rejects invalid configurations. The validation checks:
- Each policy has at least one
include,include_any, orexcludeblock. - The
match_typeisstrictorregex. - Attribute keys are valid TraceQL identifiers.
- Only
resourceandspanscopes are supported. Other scopes such asevent,link, orinstrumentationare rejected. - Regex patterns compile successfully.
- Intrinsic values are valid:
kindmust be a recognizedSPAN_KIND_*value,statusmust be a recognizedSTATUS_CODE_*value.
If you’re upgrading from Tempo 2.x, refer to Stricter filter policy validation in the 3.0 release notes for details on how this affects existing configurations.
Server-side and client-side generation
You can also generate span metrics client-side, with the otelcol.connector.spanmetrics component in Grafana Alloy or the OpenTelemetry Collector.
The recommended Alloy configuration sets namespace = "traces.spanmetrics", so client-side metric names start with traces_spanmetrics_, the same prefix the generator uses.
Once exported to Prometheus, the client-side request counter and the generator’s request counter both become traces_spanmetrics_calls_total, so you can’t tell them apart by name.
If both run for the same services, those counters overlap, double-count request rates, and inflate active series.
For this reason, run only one of them for a given set of services.
To decide which approach to use, how sampling affects coverage, and how to avoid double-counting, refer to Choose where to generate metrics from traces.
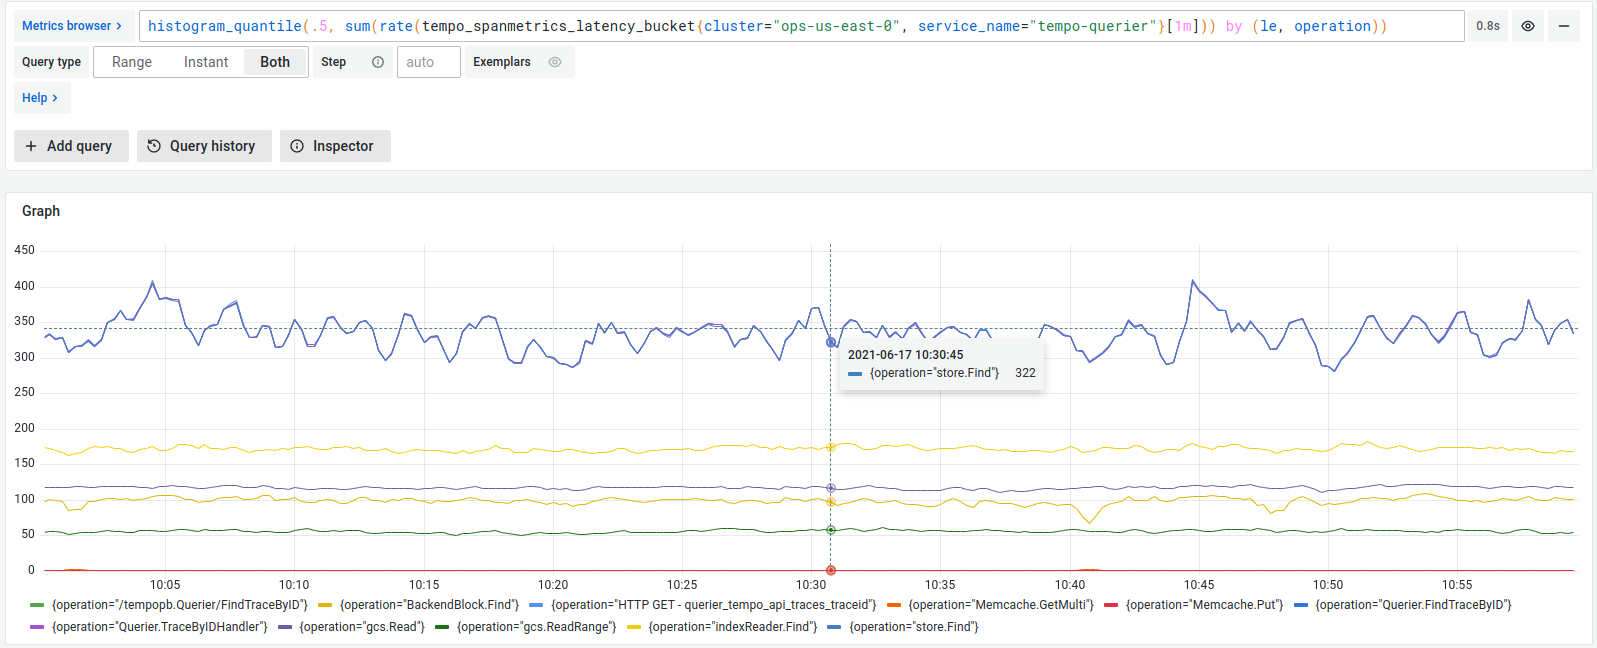
Example
Was this page helpful?
Related resources from Grafana Labs