This is documentation for the next version of Grafana Tempo documentation. For the latest stable release, go to the latest version.
Create custom service graphs
You can craft custom service graphs based on the metrics generated from metrics-generator.
Before you begin
For custom service graphs, you’ll use:
- Tempo metrics-generator
- Grafana deployment of version v10 or higher
- Grafana Node graph panel
The metrics-generator creates multiple metrics, including traces_service_graph_request_total. This metric holds:
- relationships between services
- total number of requests performed between services
Create one or more Grafana dashboards
- In Grafana, create a new dashboard.
- Add two variables:
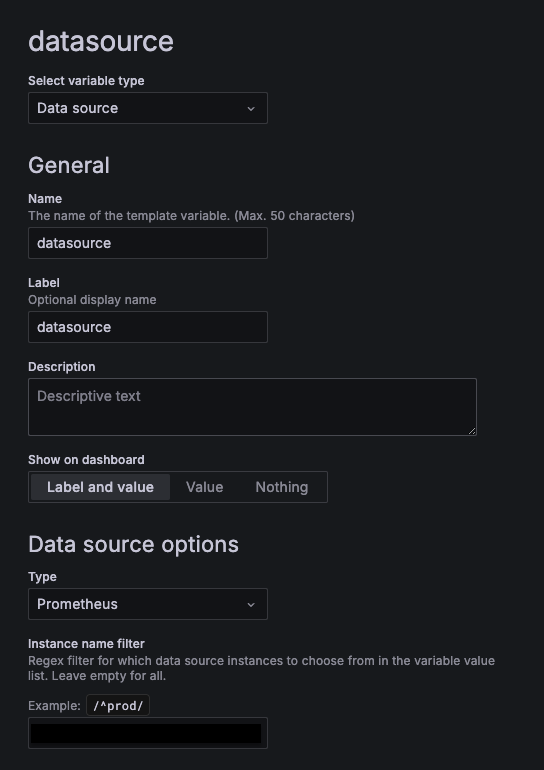
- Data source of type
Prometheus.![Custom service graph Grafana data source variable]()
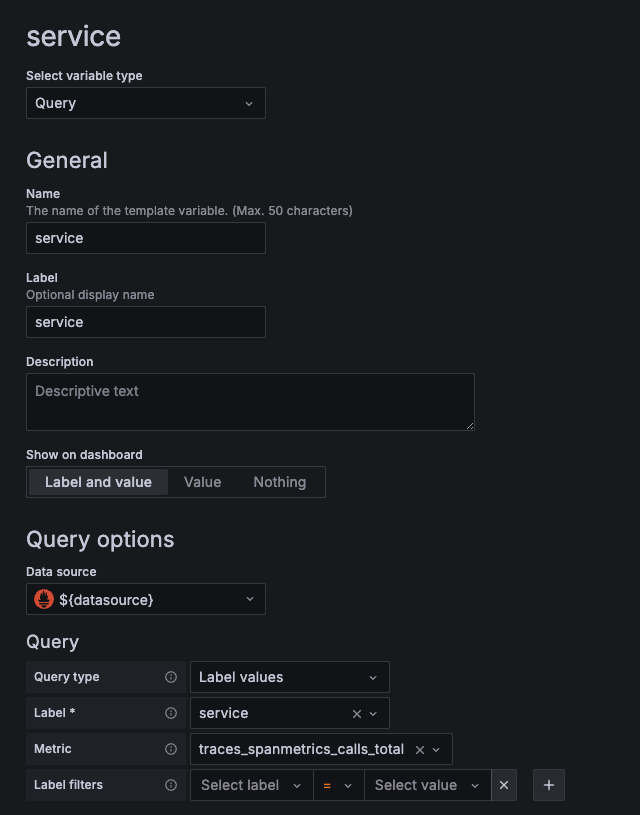
- Service of type
Label values, enable multi-value option![Custom service graph service variable]()
- Data source of type
Add a panel
- Create a panel with a single query called
edges. - Select your Prometheus data source with metrics from the metrics-generator.
- Query using the following example:
label_join( label_join( label_join( sum(increase(traces_service_graph_request_total{server=~"$service"}[5m])) by (server, client) > 0 or sum(increase(traces_service_graph_request_total{client=~"$service"}[5m])) by (server, client) > 0, "source", "", "client"), "target", "", "server"), "id", "-", "server", "client") - Use Instant query type.
- If you encounter issues, switch to the Table data visualization. Refer to the Node graph panel documentation for more options and expected data shape.

All data transformations are done with the Prometheus label_join operators.
Explanation of the query:
- The first
label_joincreates a new fieldidwhich is required by the Node graph panel. - The second and third
label_joincopy the client and server labels to source and target respectively, as these names are also required by Node graph panel. traces_service_graph_request_totalis queried twice with theORoperator to get a combination of requests from and to all of the selected services.
This query gets most of the job done. However, it’s limitations can’t be compensated for even using the Grafana transform data feature. These limitations include:
- Unable to add request stats to nodes and edges, such as req/sec and error rates
- Unable to add custom icons for nodes
These limitations can be overcome by wrapping the Prometheus query into a REST API, which provides more flexibility with query results data transformations. You can use Grafana Infinity data source to visualize data from REST API.


