Caution
As of 2026-03-24, the Grafana OnCall OSS project is archived. The grafana/oncall repository is read-only, and active development continues in Grafana Cloud IRM. For a fully supported and actively maintained alternative, Grafana Cloud IRM offers a modern approach to incident response and on-call management.
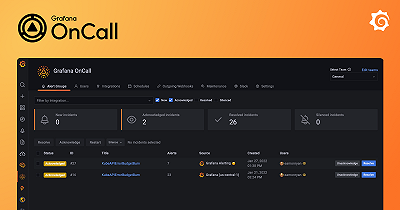
Grafana OnCall integrations
An integration serves as the primary entry point for alerts that are processed by Grafana OnCall. Integrations receive alerts through a unique API URL, interpret them using a set of templates tailored for the specific monitoring system, and initiate escalations as necessary.
For more information about how to configure an integration, refer to Configure and manage integrations.
Understand the integration alert flow
An alert is received on an integration’s Unique URL as an HTTP POST request with a JSON payload (or via Inbound email for email integrations).
The incoming alert is routed according to the Routing Template.
Alerts are grouped based on the Grouping ID Template and rendered using Appearance Templates.
The alert group can be published to messaging platforms, based on the Publish to Chatops configuration.
The alert group is escalated to users according to the Escalation Chains selected for the route.
An alert group can be acknowledged or resolved with status updates based on its Behavioral Templates.
Users can perform actions listed in the Alert Workflow section.
Explore available integrations
Refer to Integration references for a list of available integrations and specific set up instructions.