Menu
Important: This documentation is about an older version. It's relevant only to the release noted, many of the features and functions have been updated or replaced. Please view the current version.
Open source
Grafana Mimir Writes networking dashboard
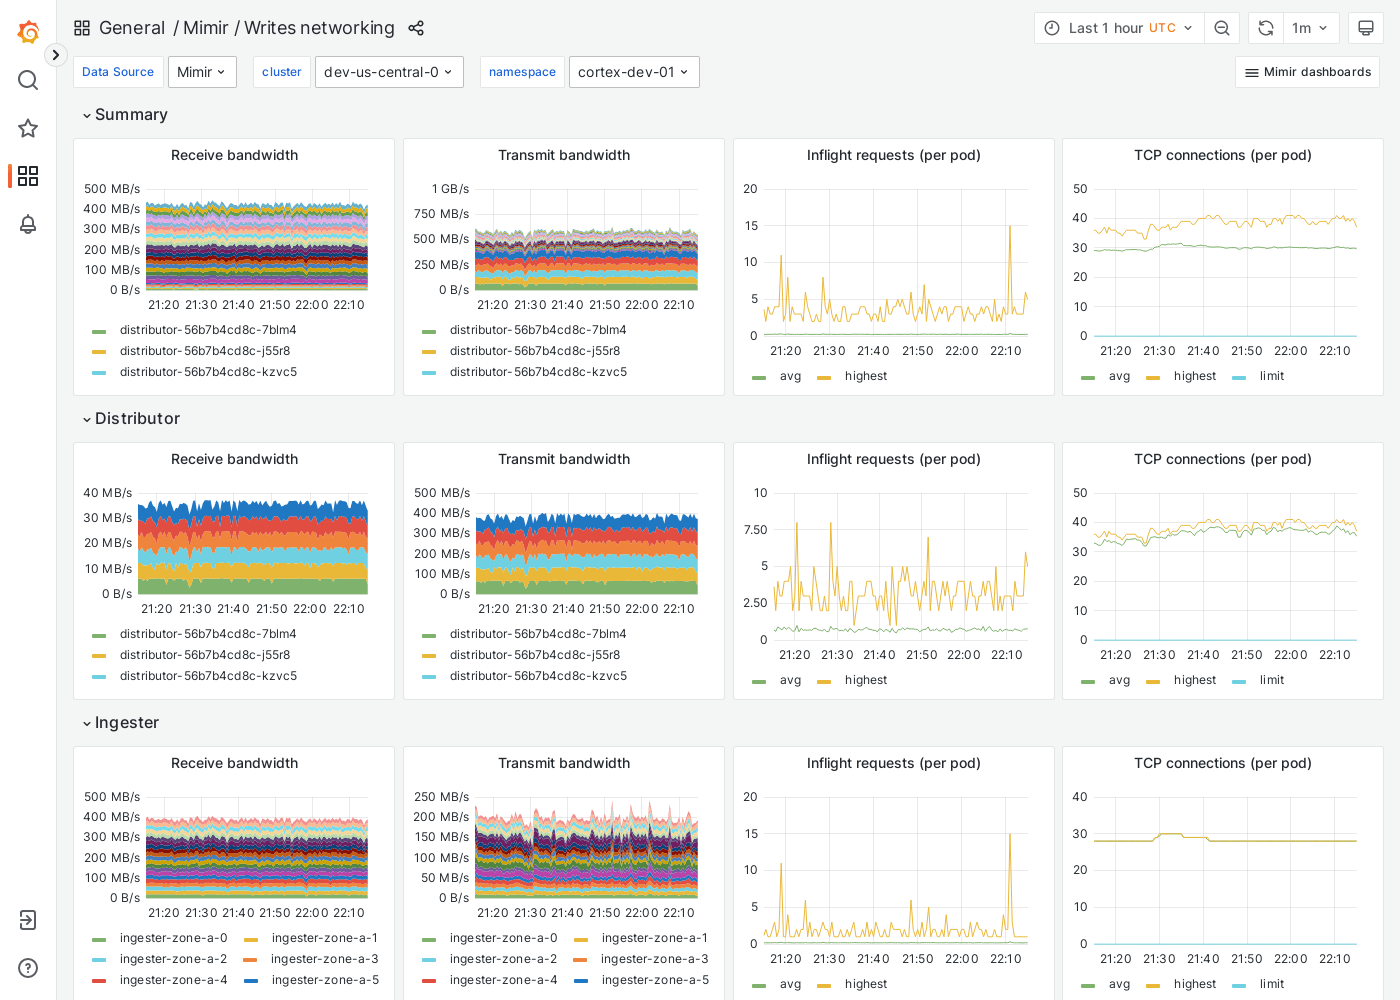
The Writes networking dashboard shows receive/transmit bandwidth, inflight requests, and TCP connections. The dashboard isolates each service on the write path into its own section and displays the order in which a write request flows.
This dashboard requires additional resources metrics.
Example
The following example shows a Writes networking dashboard from a demo cluster.
Was this page helpful?
Related resources from Grafana Labs
Additional helpful documentation, links, and articles:

Intro to metrics with Grafana: Prometheus, Grafana Mimir, and beyond
In this webinar, we’ll go over challenges when scaling metrics systems, with a particular focus on Prometheus and Grafana Mimir.

Intro to Grafana Mimir: The open source time series database that scales to 1 billion metrics & beyond
In this webinar, learn about Grafana Mimir, our open source solution for extending Prometheus at organizations needing massive scale, rapid query performance.

For billion-series scale or home IoT projects, get started in minutes with Grafana Mimir
Learn how easy it is to get started with Mimir, no matter how many or few time series you need to store.