
Important: This documentation is about an older version. It's relevant only to the release noted, many of the features and functions have been updated or replaced. Please view the current version.
Get started with Grafana Loki
Loki is a horizontally scalable, highly available, multi-tenant log aggregation system inspired by Prometheus. It is designed to be very cost-effective and easy to operate. It does not index the contents of the logs, but rather a set of labels for each log stream.
Because all Loki implementations are unique, the installation process is different for every customer. But there are some steps in the process that should be common to every installation.
To collect logs and view your log data generally involves the following steps:
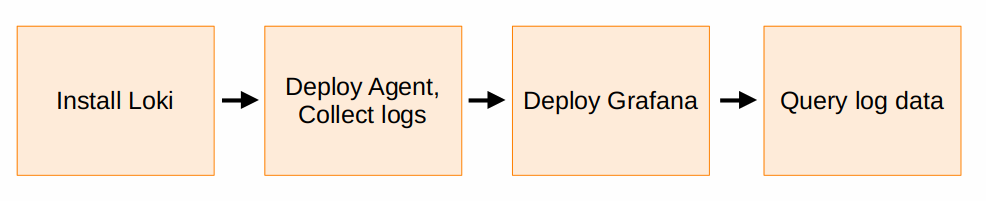
- Install Loki on Kubernetes in simple scalable mode, using the recommended
Helm chart. Supply the Helm chart with your object storage authentication details.
- Storage options
- Configuration reference
- There are examples for specific Object Storage providers that you can modify.
- Deploy Grafana Alloy to collect logs from your applications.
- On Kubernetes, deploy Grafana Alloy using the Helm chart. Configure Grafana Alloy to scrape logs from your Kubernetes cluster, and add your Loki endpoint details. See the following section for an example Grafana Alloy configuration file.
- Add labels to your logs following our best practices. Most Loki users start by adding labels that describe where the logs are coming from (region, cluster, environment, etc.).
- Deploy Grafana or Grafana Cloud and configure a Loki data source.
- Select the Explore feature in the Grafana main menu. To view logs in Explore:
- Pick a time range.
- Choose the Loki data source.
- Use LogQL in the query editor, use the Builder view to explore your labels, or select from sample pre-configured queries using the Kick start your query button.
Next steps: Learn more about the Loki query language, LogQL.
Example Grafana Alloy and Agent configuration files to ship Kubernetes Pod logs to Loki
To deploy Grafana Alloy or Agent to collect Pod logs from your Kubernetes cluster and ship them to Loki, you can use a Helm chart, and a values.yaml file.
This sample values.yaml file is configured to:
- Install Grafana Agent to discover Pod logs.
- Add
containerandpodlabels to the logs. - Push the logs to your Loki cluster using the tenant ID
cloud.
Install Loki with the Helm chart.
Deploy either Grafana Alloy or the Grafana Agent, using the Helm chart:
Create a
values.yamlfile, based on the following example, making sure to update the value forforward_to = [loki.write.endpoint.receiver]:alloy: mounts: varlog: true configMap: content: | logging { level = "info" format = "logfmt" } discovery.kubernetes "pods" { role = "pod" } loki.source.kubernetes "pods" { targets = discovery.kubernetes.pods.targets forward_to = [loki.write.endpoint.receiver] } loki.write "endpoint" { endpoint { url = "http://loki-gateway.default.svc.cluster.local:80/loki/api/v1/push" tenant_id = "local" } }agent: mounts: varlog: true configMap: content: | logging { level = "info" format = "logfmt" } discovery.kubernetes "k8s" { role = "pod" } discovery.relabel "k8s" { targets = discovery.kubernetes.k8s.targets rule { source_labels = ["__meta_kubernetes_pod_name"] action = "replace" target_label = "pod" } rule { source_labels = ["__meta_kubernetes_pod_container_name"] action = "replace" target_label = "container" } rule { source_labels = ["__meta_kubernetes_namespace", "__meta_kubernetes_pod_label_name"] target_label = "job" separator = "/" } rule { source_labels = ["__meta_kubernetes_pod_uid", "__meta_kubernetes_pod_container_name"] target_label = "__path__" separator = "/" replacement = "/var/log/pods/*$1/*.log" } } local.file_match "pods" { path_targets = discovery.relabel.k8s.output } loki.source.file "pods" { targets = local.file_match.pods.targets forward_to = [loki.write.endpoint.receiver] } loki.write "endpoint" { endpoint { url = "http://loki-gateway:80/loki/api/v1/push" tenant_id = "cloud" } }Then install Alloy or the Agent in your Kubernetes cluster using:
helm install alloy grafana/alloy -f ./values.ymlhelm upgrade -f values.yaml agent grafana/grafana-agent


