Important: This documentation is about an older version. It's relevant only to the release noted, many of the features and functions have been updated or replaced. Please view the current version.
Run the Promtail client on AWS EC2
In this tutorial we’re going to setup Promtail on an AWS EC2 instance and configure it to sends all its logs to a Grafana Loki instance.
Requirements
Before you start you’ll need:
- An AWS account (with the
AWS_ACCESS_KEYandAWS_SECRET_KEY) - A VPC that is routable from the internet. (Follow those instructions if you need to create one)
- A SSH public key. (Follow those instructions if you need a new one)
- The AWS CLI configured (run
aws configure). - A Grafana instance with a Loki data source already configured, you can use GrafanaCloud free trial.
For the sake of simplicity we’ll use a Grafana Cloud Loki and Grafana instances, you can get a free account for this tutorial at [Grafana Cloud], but all the steps are the same if you’re running your own Open Source version of Loki and Grafana instances.
To make it easy to learn all the following instructions are manual, however in a real setup we recommend you to use provisioning tools such as Terraform, CloudFormation, Ansible or Chef.
Creating an EC2 instance
As a first step we’re going to import our SSH key to AWS so that we can SSH to our future EC2 instance, let’s run our first command:
aws ec2 import-key-pair --key-name "promtail-ec2" --public-key-material fileb://~/.ssh/id_rsa.pubNext we’re going to create a security group, make sure to note the group id, we’ll need it for the following command:
aws ec2 create-security-group --group-name promtail-ec2  --description "promtail on ec2" --vpc-id vpc-668d120f
{
    "GroupId": "sg-02c489bbdeffdca1d"
}
Now let’s authorize inbound access for SSH and Promtail server:
aws ec2 authorize-security-group-ingress --group-id sg-02c489bbdeffdca1d --protocol tcp --port 22 --cidr 0.0.0.0/0
aws ec2 authorize-security-group-ingress --group-id sg-02c489bbdeffdca1d --protocol tcp --port 3100 --cidr 0.0.0.0/0
Note
You don’t need to open those ports to all IPs as shown above you can use your own IP range.
We’re going to create an Amazon Linux 2 instance as this is one of the most popular but feel free to use the AMI of your choice.
To create the instance use the following command, make sure to note the instance id:
aws ec2 run-instances --image-id ami-016b213e65284e9c9 --count 1 --instance-type t2.micro --key-name promtail-ec2 --security-groups promtail-ec2To make it more interesting later let’s tag (Name=promtail-demo) our instance:
aws ec2 create-tags --resources i-041b0be05c2d5cfad --tags Key=Name,Value=promtail-demoNote
Tags enable you to categorize your AWS resources in different ways, for example, by purpose, owner, or environment. This is useful when you have many resources of the same type—you can quickly identify a specific resource based on the tags that you’ve assigned to it. You’ll see later, Promtail can transform those tags into [Loki labels][labels].
Finally let’s grab the public DNS of our instance:
aws ec2 describe-instances --filters "Name=tag:Name,Values=promtail-demo" --query "Reservations[].Instances[].NetworkInterfaces[].Association.PublicDnsName"and start an SSH session:
ssh ec2-user@ec2-13-59-62-37.us-east-2.compute.amazonaws.comSetting up Promtail
First let’s make sure we’re running as root by using sudo -s.
Next we’ll download, install and give executable right to Promtail.
mkdir /opt/promtail && cd /opt/promtail
curl -O -L "https://github.com/grafana/loki/releases/download/v2.0.0/promtail-linux-amd64.zip"
unzip "promtail-linux-amd64.zip"
chmod a+x "promtail-linux-amd64"
Now we’re going to download the Promtail configuration file below and edit it, don’t worry we will explain what those means. The file is also available as a gist at cyriltovena/promtail-ec2.yaml.
curl https://raw.githubusercontent.com/grafana/loki/main/docs/sources/send-data/promtail/cloud/ec2/promtail-ec2.yaml > ec2-promtail.yaml
vi ec2-promtail.yamlserver:
http_listen_port: 3100
grpc_listen_port: 0
clients:
- url: https://<user id>:<api secret>@logs-prod-us-central1.grafana.net/loki/api/v1/push
positions:
filename: /opt/promtail/positions.yaml
scrape_configs:
- job_name: ec2-logs
ec2_sd_configs:
- region: us-east-2
access_key: REDACTED
secret_key: REDACTED
relabel_configs:
- source_labels: [__meta_ec2_tag_Name]
target_label: name
action: replace
- source_labels: [__meta_ec2_instance_id]
target_label: instance
action: replace
- source_labels: [__meta_ec2_availability_zone]
target_label: zone
action: replace
- action: replace
replacement: /var/log/**.log
target_label: __path__
- source_labels: [__meta_ec2_private_dns_name]
regex: "(.*)"
target_label: __host__The server section indicates Promtail to bind his http server to 3100. Promtail serves HTTP pages for troubleshooting service discovery and targets.
The clients section allow you to target your loki instance, if you’re using GrafanaCloud simply replace <user id> and <api secret> with your credentials. Otherwise just replace the whole URL with your custom Loki instance.(e.g http://my-loki-instance.my-org.com/loki/api/v1/push)
Promtail uses the same Prometheus scrape_configs. This means if you already own a Prometheus instance the config will be very similar and easy to grasp.
Since we’re running on AWS EC2 we want to uses EC2 service discovery, this will allows us to scrape metadata about the current instance (and even your custom tags) and attach those to our logs. This way managing and querying on logs will be much easier.
Make sure to replace accordingly you current region, access_key and secret_key, alternatively you can use an AWS Role ARN, for more information about this, see documentation for ec2_sd_config.
Finally the relabeling_configs section has three purposes:
Selecting the labels discovered you want to attach to your targets. In our case here, we’re keeping
instance_idas instance, the tagNameas name and thezoneof the instance. Make sure to check out the Prometheusec2_sd_configdocumentation for the full list of available labels.Choosing where Promtail should find log files to tail, in our example we want to include all log files that exist in
/var/logusing the glob/var/log/**.log. If you need to use multiple glob, you can simply add another job in yourscrape_configs.Ensuring discovered targets are only for the machine Promtail currently runs on. This is achieved by adding the label
__host__using the incoming metadata__meta_ec2_private_dns_name. If it doesn’t match the currentHOSTNAMEenvironment variable, the target will be dropped. If__meta_ec2_private_dns_namedoesn’t match your instance’s hostname (on EC2 Windows instance for example, where it is the IP address and not the hostname), you can hardcode the hostname at this stage, or check if any of the instances tag contain the hostname (__meta_ec2_tag_<tagkey>: each tag value of the instance)
Alright we should be ready to fire up Promtail, we’re going to run it using the flag --dry-run. This is perfect to ensure everything is correctly, specially when you’re still playing around with the configuration. Don’t worry when using this mode, Promtail won’t send any logs and won’t remember any file positions.
./promtail-linux-amd64 -config.file=./ec2-promtail.yaml --dry-runIf everything is going well Promtail should print out log lines with their labels discovered instead of sending them to Loki, like shown below:
2020-07-08T14:51:38-0700 {filename="/var/log/cloud-init.log", instance="i-041b0be05c2d5cfad", name="promtail-demo", zone="us-east-2c"} Jul 07 21:37:24 cloud-init[3035]: util.py[DEBUG]: loaded blob returned None, returning default.Don’t hesitate to edit the your config file and start Promtail again to try your config out.
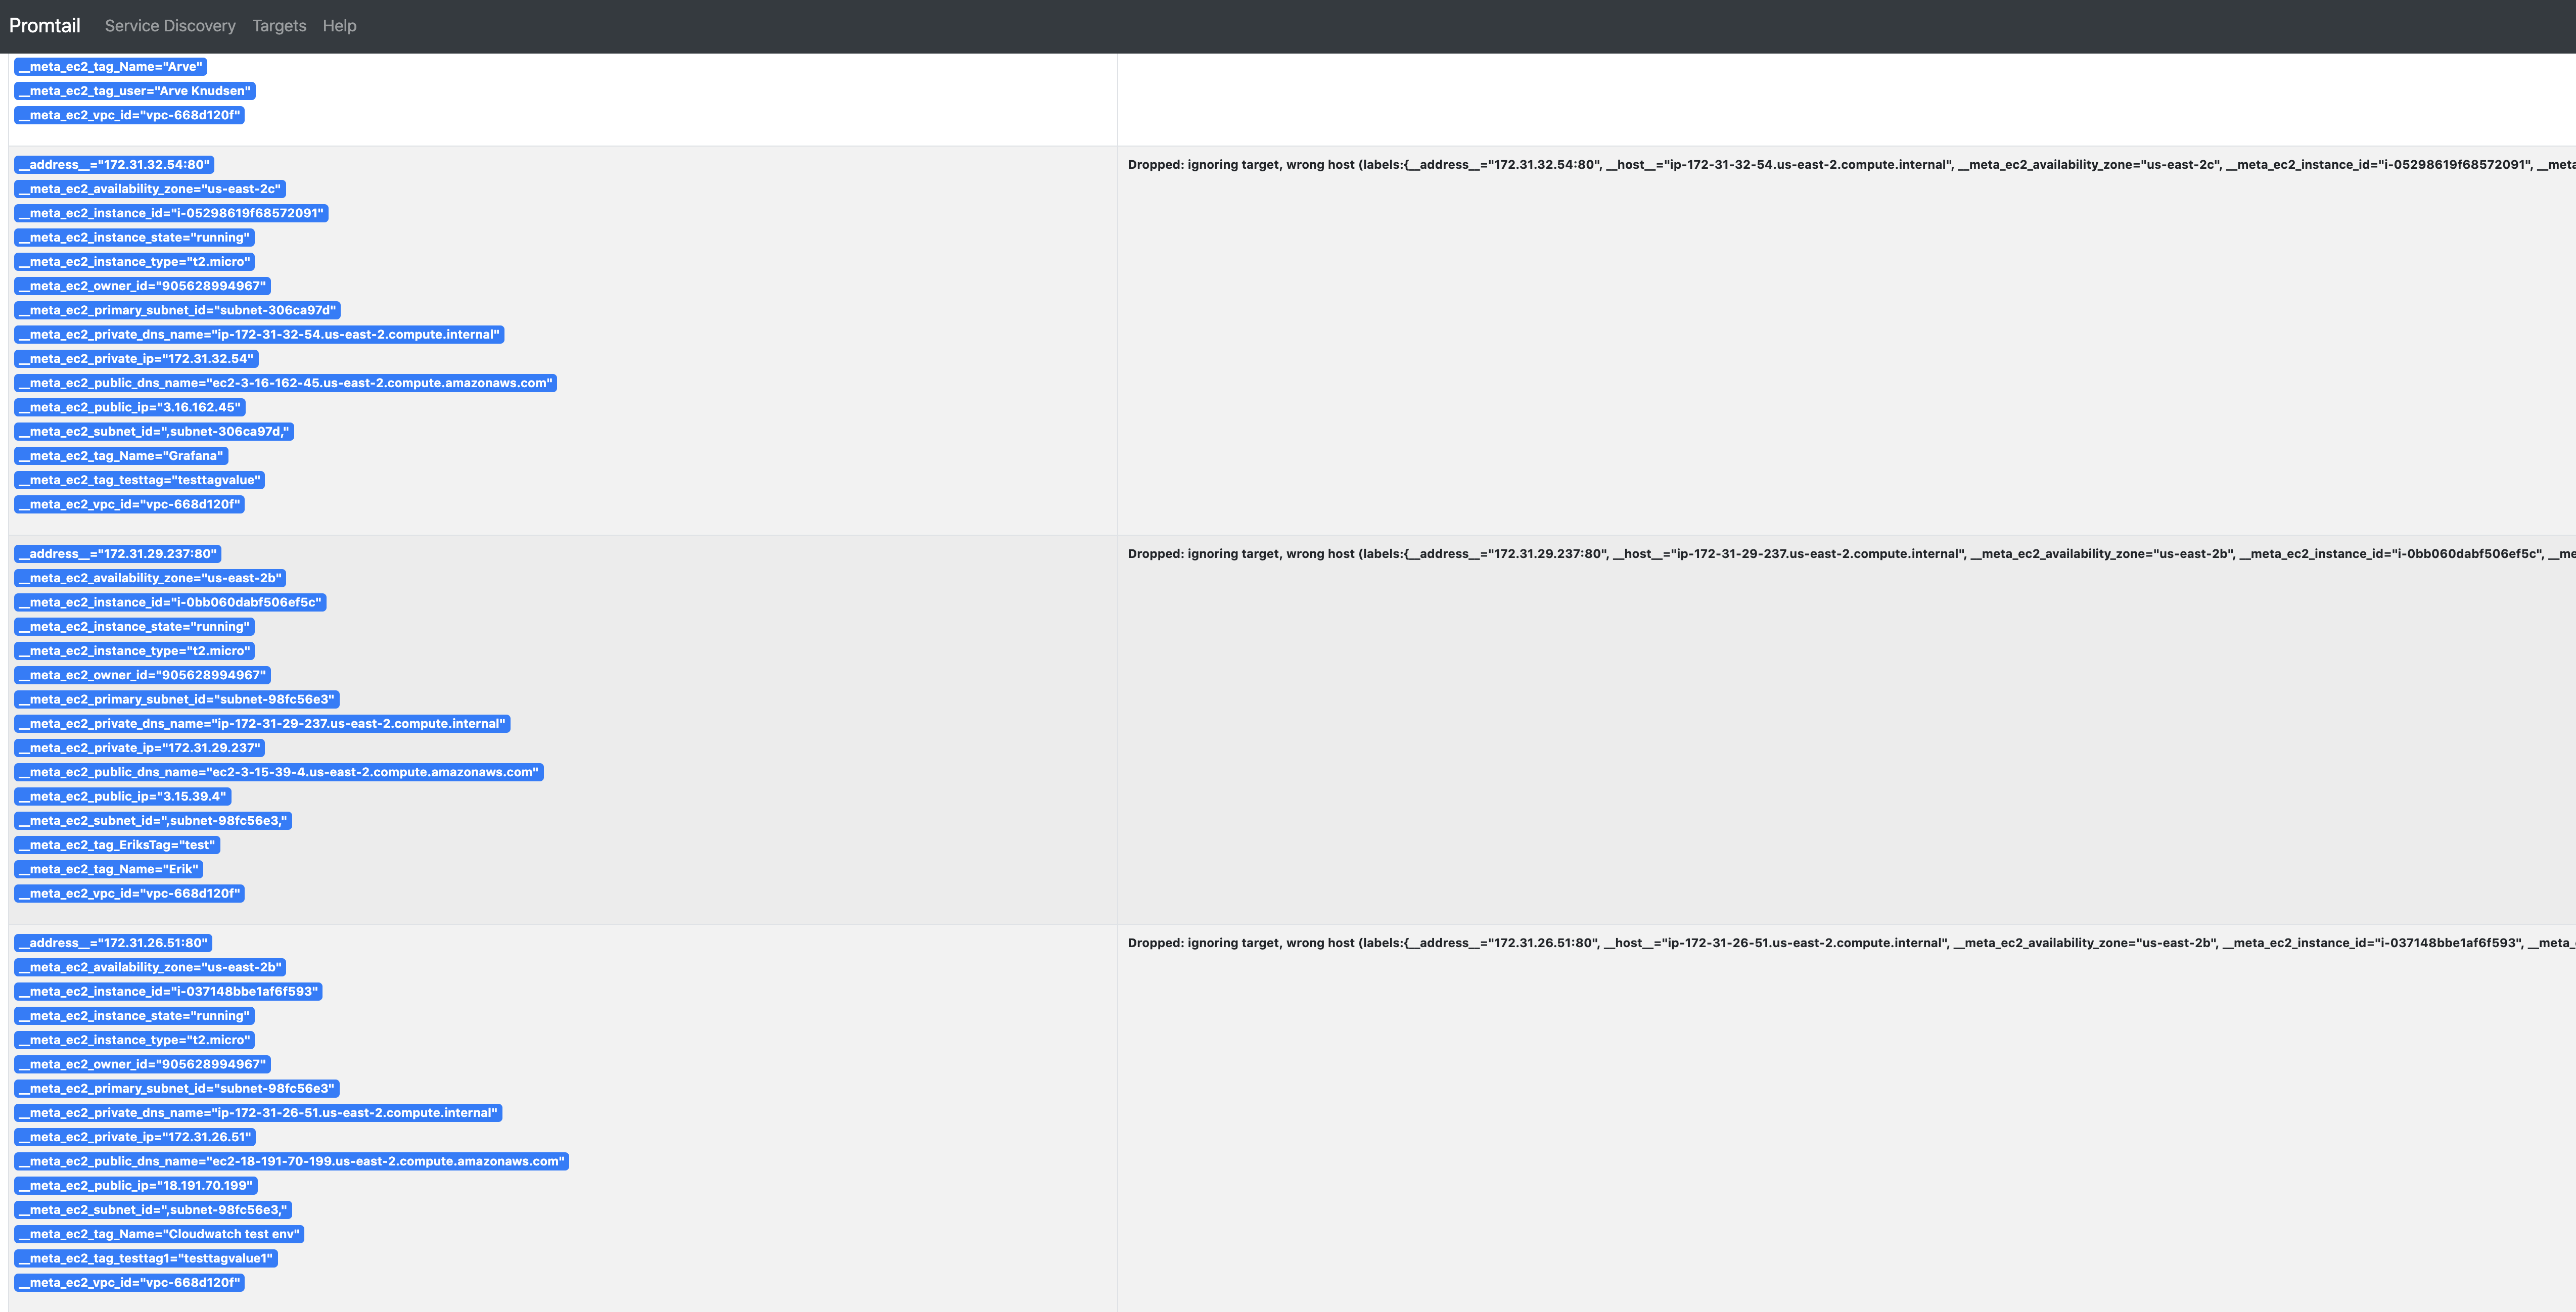
If you want to see existing targets and available labels you can reach Promtail server using the public dns assigned to your instance:
open http://ec2-13-59-62-37.us-east-2.compute.amazonaws.com:3100/For example the page below is the service discovery page. It shows you all discovered targets, with their respective available labels and the reason it was dropped if it was the case.

This page is really useful to understand what labels are available to forward with the relabeling configuration but also why Promtail is not scraping your target.
Configuring Promtail as a service
Now that we have correctly configured Promtail. We usually want to make sure it runs as a systemd service, so it can automatically restart on failure or when the instance restart.
Let’s create a new service using vim /etc/systemd/system/promtail.service and copy the service definition below:
[Unit]
Description=Promtail

[Service]
User=root
WorkingDirectory=/opt/promtail/
ExecStartPre=/bin/sleep 30
ExecStart=/opt/promtail/promtail-linux-amd64 --config.file=./ec2-promtail.yaml
SuccessExitStatus=143
TimeoutStopSec=10
Restart=on-failure
RestartSec=5

[Install]
WantedBy=multi-user.target
Let’s reload the systemd, enable then start the Promtail service:
systemctl daemon-reload
systemctl enable promtail.service
systemctl start promtail.service
You can verify that the service run correctly using the following command:
systemctl status promtail.service -l

● promtail.service - Promtail
   Loaded: loaded (/etc/systemd/system/promtail.service; enabled; vendor preset: disabled)
   Active: active (running) since Wed 2020-07-08 15:48:57 UTC; 4s ago
 Main PID: 2732 (promtail-linux-)
   CGroup: /system.slice/promtail.service
           └─2732 /opt/promtail/promtail-linux-amd64 --config.file=./ec2-promtail.yaml

Jul 08 15:48:57 ip-172-31-45-69.us-east-2.compute.internal systemd[1]: Started Promtail.
Jul 08 15:48:57 ip-172-31-45-69.us-east-2.compute.internal systemd[1]: Starting Promtail...
Jul 08 15:48:57 ip-172-31-45-69.us-east-2.compute.internal promtail-linux-amd64[2732]: level=warn ts=2020-07-08T15:48:57.559085451Z caller=filetargetmanager.go:98 msg="WARNING!!! entry_parser config is deprecated, please change to pipeline_stages"
Jul 08 15:48:57 ip-172-31-45-69.us-east-2.compute.internal promtail-linux-amd64[2732]: level=info ts=2020-07-08T15:48:57.559869071Z caller=server.go:179 http=[::]:3100 grpc=[::]:35127 msg="server listening on addresses"
Jul 08 15:48:57 ip-172-31-45-69.us-east-2.compute.internal promtail-linux-amd64[2732]: level=info ts=2020-07-08T15:48:57.56029474Z caller=main.go:67 msg="Starting Promtail" version="(version=1.6.0, branch=HEAD, revision=12c7eab8)"
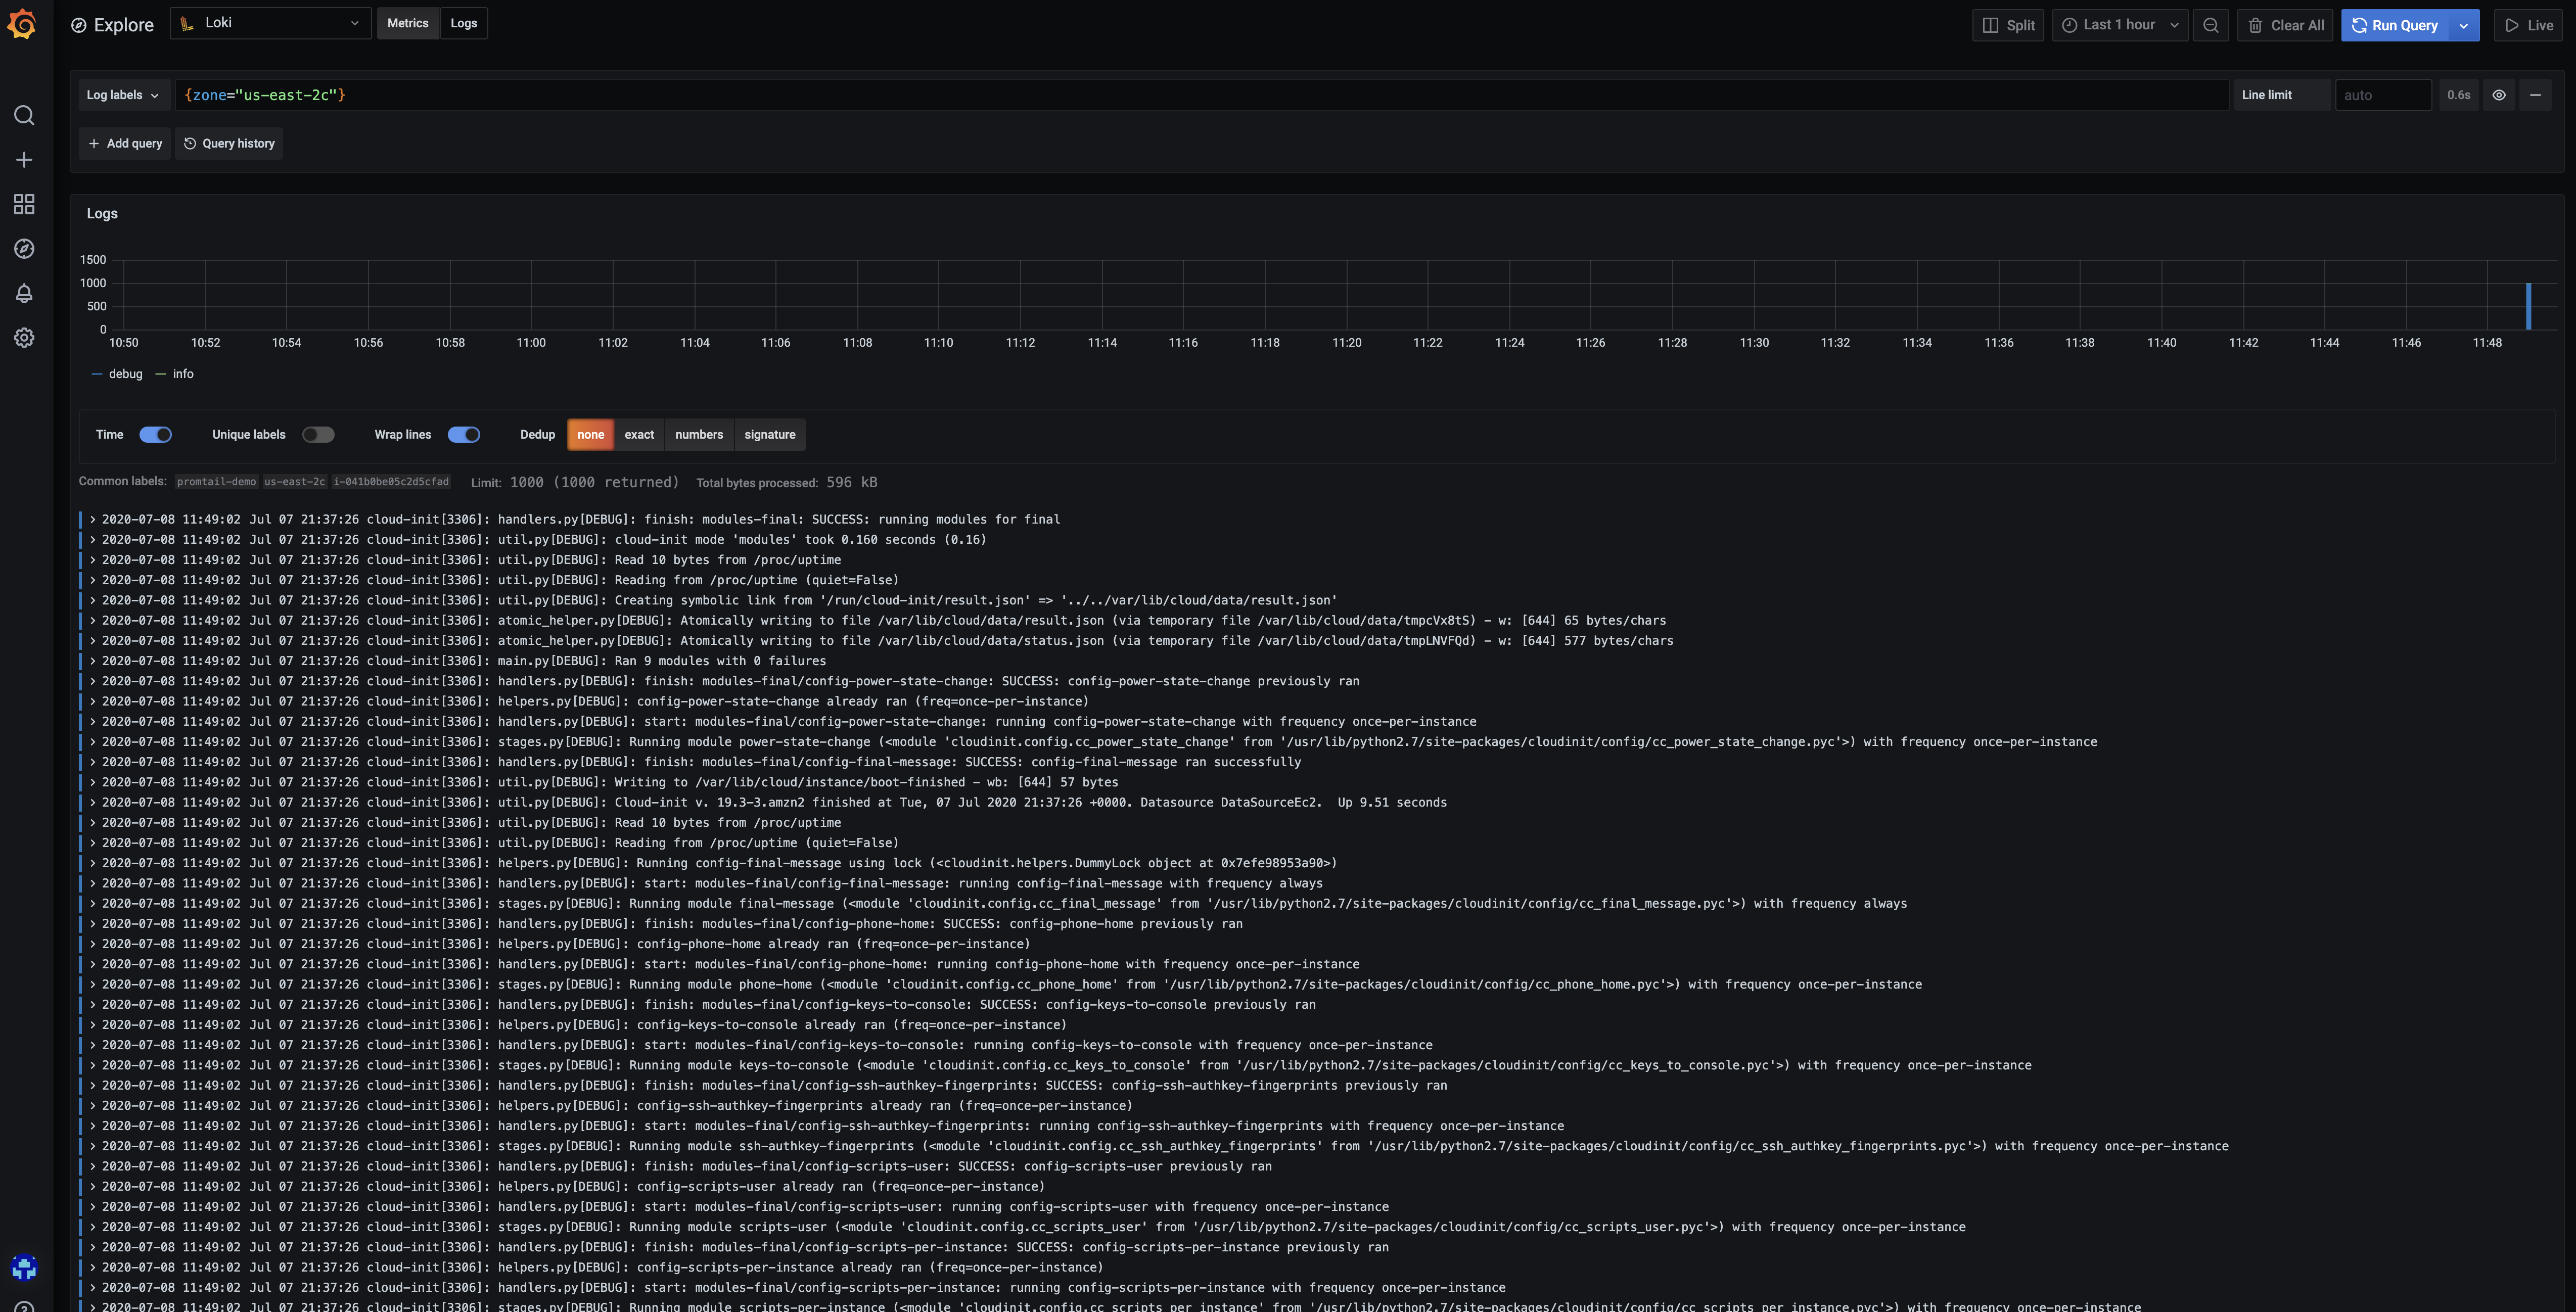
You can now verify in Grafana that Loki has correctly received your instance logs by using the LogQL query {zone="us-east-2"}.

Sending systemd logs
Just like we did with Promtail, you’ll most likely manage your applications with systemd which usually store applications logs in journald. Promtail actually support scraping logs from journald so let’s configure it.
We will edit our previous config (vi ec2-promtail.yaml) and add the following block in the scrape_configs section.
  - job_name: journal
    journal:
      json: false
      max_age: 12h
      path: /var/log/journal
      labels:
        job: systemd-journal
    relabel_configs:
      - source_labels: ['__journal__systemd_unit']
        target_label: 'unit'
Note that you can use relabeling to convert systemd labels to match what you want. Finally make sure that the path of journald logs is correct, it might be different on some systems.
Note
You can download the final config example from our [GitHub repository][final config].
That’s it, save the config and you can reboot the machine (or simply restart the service systemctl restart promtail.service).
Let’s head back to Grafana and verify that your Promtail logs are available in Grafana by using the LogQL query {unit="promtail.service"} in Explore. Finally make sure to checkout live tailing to see logs appearing as they are ingested in Loki.


