Work with demo data in Grafana Cloud
If you want to explore Grafana Cloud initially without instrumenting and connecting your own applications, you can install a set of example data sources and two sets of dashboards that cover the following use cases:
- A demo tailored for Site Reliability Engineers (SREs) featuring metrics, logs, and traces generated by a fictional Pizza-as-a-Service website
- A weather demo that shows weather data from various locations worldwide
These demo data sources and dashboards provide you with visualizations that you can explore.
Note
The data sources used in these demonstrations are provided and hosted free of charge by Grafana Cloud. You are not billed for using them.
Install demo data sources and dashboards
To install the demo data source and dashboards, complete the following steps:
Sign in to your Grafana Cloud account.
On the left navigation, click Apps > Demo Data Dashboards.
Select a demo, and click on Install Dashboards.
This installs the required data sources and dashboards into your Grafana Cloud instance.
Note
As the installation uses your current level of access, installation can only be performed by users who can create data sources and dashboards, such as the built-in
Administratorrole.To reset the dashboards to their original state at any point, click Reset dashboards.
Explore the data
A folder with the same name as the demo appears in your list of dashboards.
You can also build your own dashboards based on the grafanacloud-play-{logs,prom,traces} data sources.
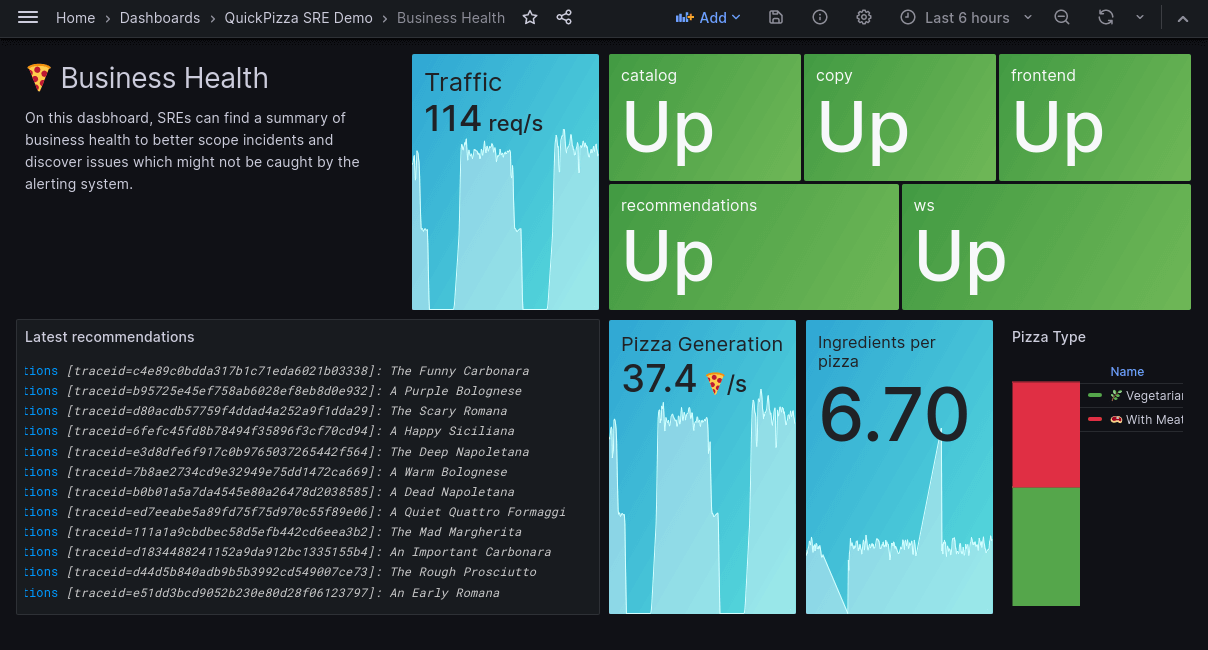
SRE demo
The SRE demo folder contains dashboards that:
- Provide an overview of system health
- Contain detailed response timings for every subsystem
- Show business metrics for the application
You can influence the metrics by checking out the live site at quickpizza.grafana.fun.
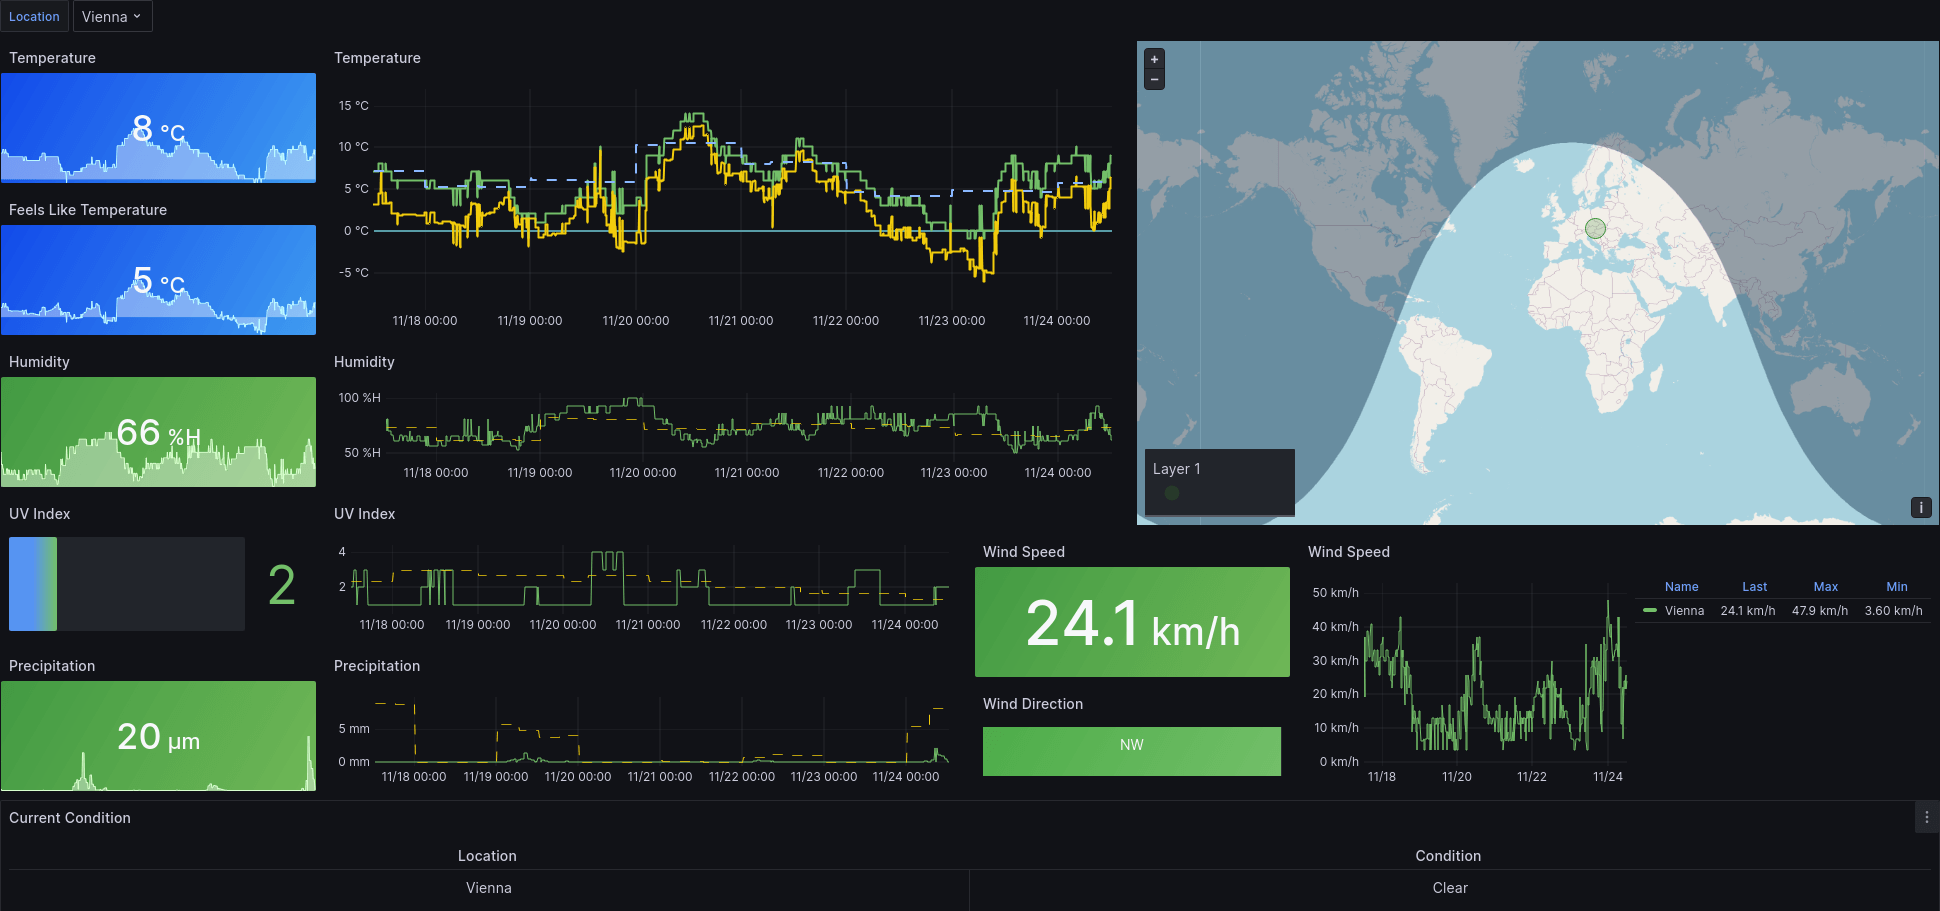
Weather demo
The weather demo has two dashboards that offer a detailed overview of the weather. Both dashboards show the same data, and differ only in showing imperial or metric units.
Advanced features
You can also use the data provided to explore more advanced Grafana Cloud features such as Application Observability and Kubernetes Monitoring. To do this, select the grafanacloud-play data sources in the respective plugin settings.
Uninstall demo data sources and dashboards
- To remove the demo data sources and dashboards, click the
Removebutton of the respective plugin. - After all dashboards are removed, remove the data sources directly from the Demo Data Dashboards app.


