Important: This documentation is about an older version. It's relevant only to the release noted, many of the features and functions have been updated or replaced. Please view the current version.
Using Graphite in Grafana
Grafana has an advanced Graphite query editor that lets you quickly navigate the metric space, add functions, change function parameters and much more. The editor can handle all types of graphite queries. It can even handle complex nested queries through the use of query references.
Adding the data source
- Open the side menu by clicking the Grafana icon in the top header.
- In the side menu under the
Dashboardslink you should find a link namedData Sources. - Click the
+ Add data sourcebutton in the top header. - Select
Graphitefrom the Type dropdown.
NOTE: If you’re not seeing the
Data Sourceslink in your side menu it means that your current user does not have theAdminrole for the current organization.
Proxy access means that the Grafana backend will proxy all requests from the browser, and send them on to the Data Source. This is useful because it can eliminate CORS (Cross Origin Site Resource) issues, as well as eliminate the need to disseminate authentication details to the browser.
Metric editor
Navigate metric segments
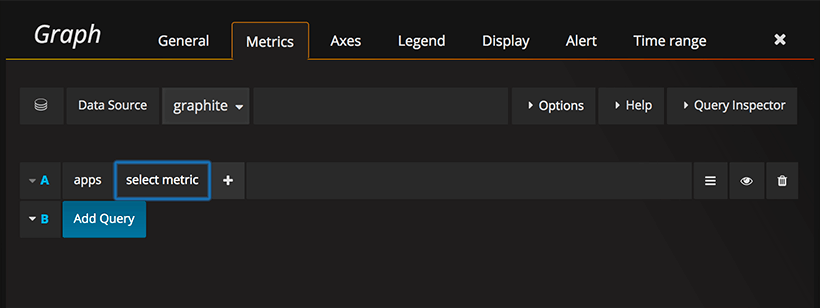
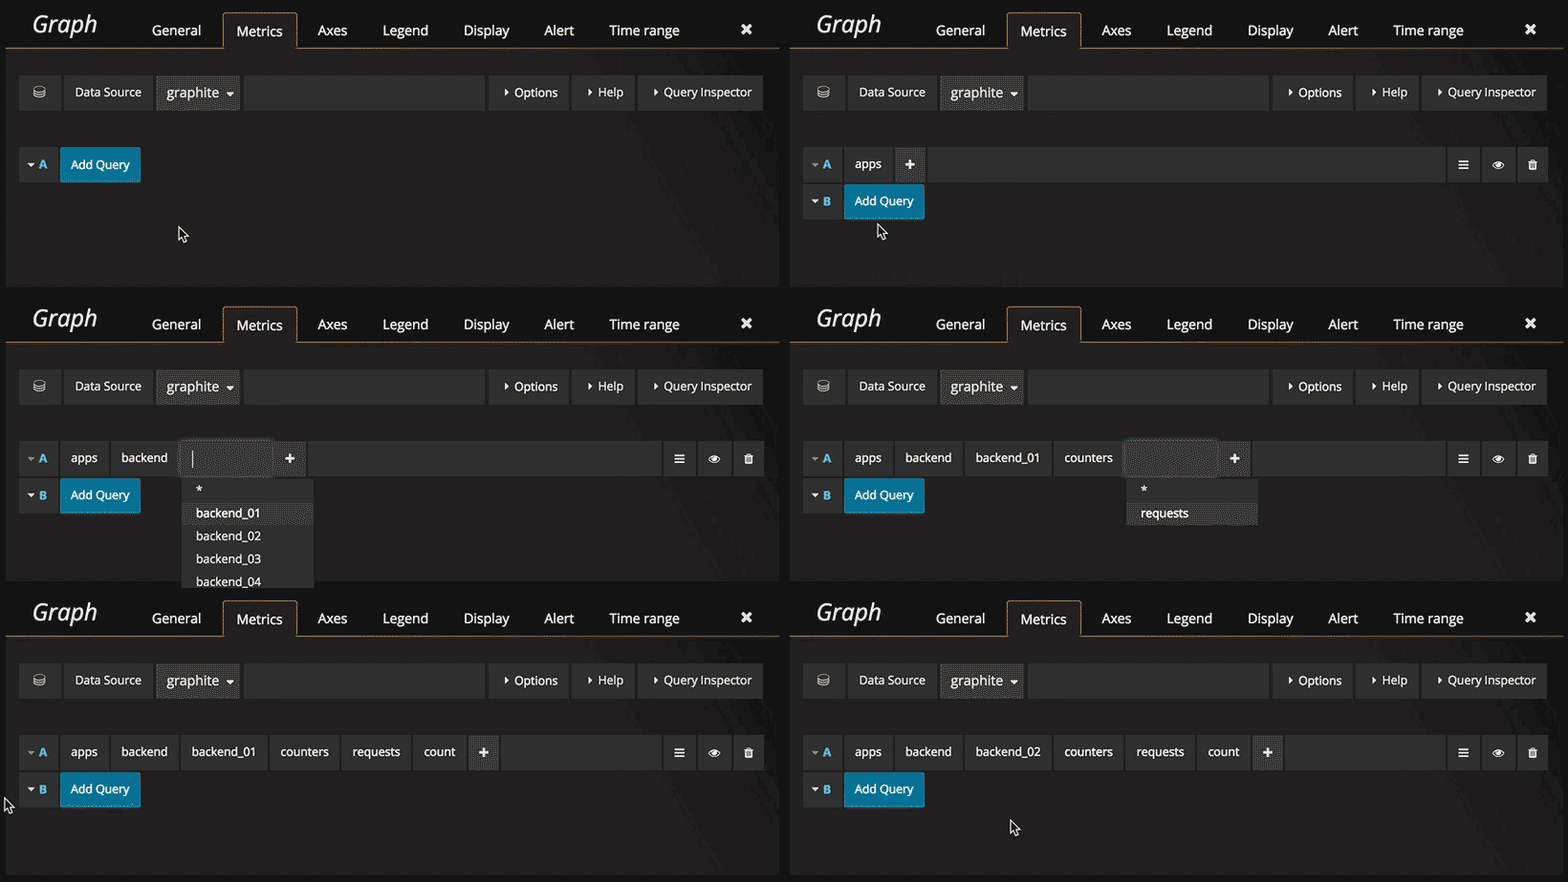
Click the Select metric link to start navigating the metric space. One you start you can continue using the mouse
or keyboard arrow keys. You can select a wildcard and still continue.
Functions
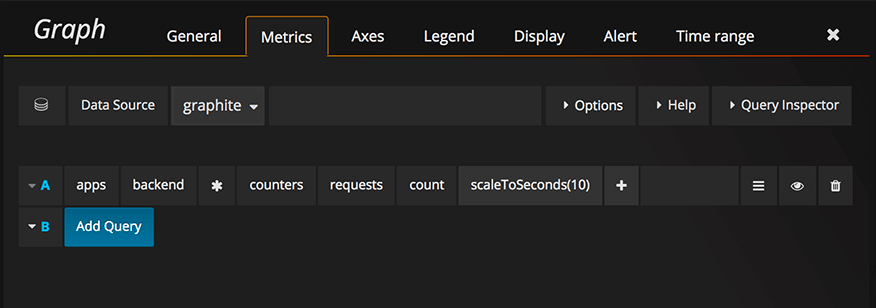
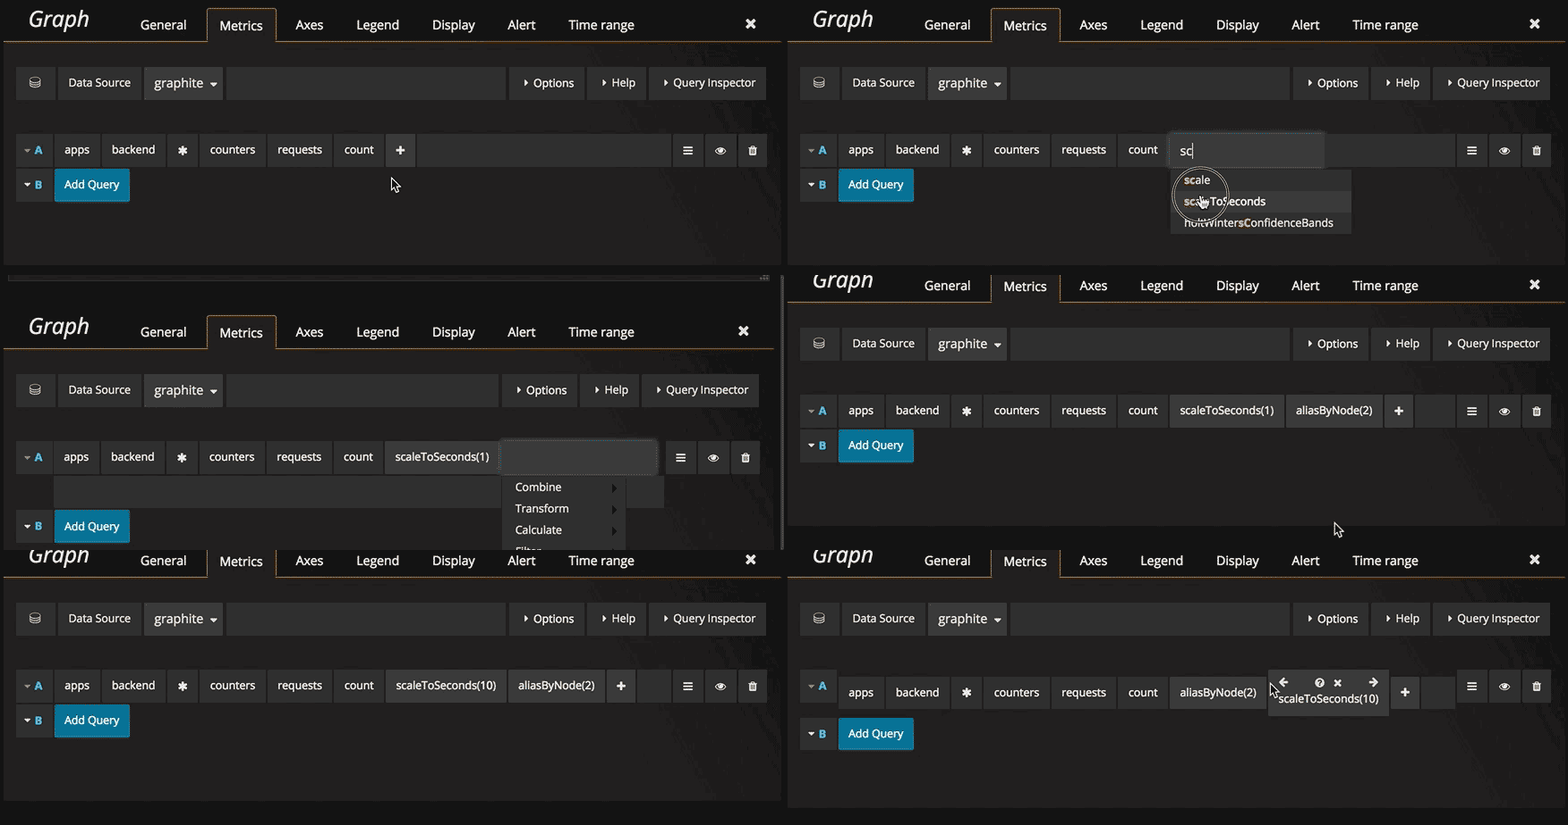
Click the plus icon to the right to add a function. You can search for the function or select it from the menu. Once a function is selected it will be added and your focus will be in the text box of the first parameter. To later change a parameter just click on it and it will turn into a text box. To delete a function click the function name followed by the x icon.
Optional parameters
Some functions like aliasByNode support an optional second argument. To add this parameter specify for example 3,-2 as the first parameter and the function editor will adapt and move the -2 to a second parameter. To remove the second optional parameter just click on it and leave it blank and the editor will remove it.
Nested Queries
You can reference queries by the row “letter” that they’re on (similar to Microsoft Excel). If you add a second query to a graph, you can reference the first query simply by typing in #A. This provides an easy and convenient way to build compounded queries.
Point consolidation
All Graphite metrics are consolidated so that Graphite doesn’t return more data points than there are pixels in the graph. By default,
this consolidation is done using avg function. You can control how Graphite consolidates metrics by adding the Graphite consolidateBy function.
Notice This means that legend summary values (max, min, total) cannot be all correct at the same time. They are calculated client side by Grafana. And depending on your consolidation function only one or two can be correct at the same time.
Templating
Instead of hard-coding things like server, application and sensor name in you metric queries you can use variables in their place. Variables are shown as dropdown select boxes at the top of the dashboard. These dropdowns makes it easy to change the data being displayed in your dashboard.
Checkout the Templating documentation for an introduction to the templating feature and the different types of template variables.
Query variable
The query you specify in the query field should be a metric find type of query. For example, a query like prod.servers.* will fill the
variable with all possible values that exist in the wildcard position.
You can also create nested variables that use other variables in their definition. For example
apps.$app.servers.* uses the variable $app in its query definition.
Variable usage
You can use a variable in a metric node path or as a parameter to a function.

There are two syntaxes:
$<varname>Example: apps.frontend.$server.requests.count[[varname]]Example: apps.frontend.[[server]].requests.count
Why two ways? The first syntax is easier to read and write but does not allow you to use a variable in the middle of a word. Use
the second syntax in expressions like my.server[[serverNumber]].count.
Example: Graphite Templated Dashboard
Annotations
Annotations allows you to overlay rich event information on top of graphs. You add annotation queries via the Dashboard menu / Annotations view.
Graphite supports two ways to query annotations. A regular metric query, for this you use the Graphite query textbox. A Graphite events query, use the Graphite event tags textbox,
specify a tag or wildcard (leave empty should also work)
Configure datasource with provisioning
It’s now possible to configure datasources using config files with Grafanas provisioning system. You can read more about how it works and all the settings you can set for datasources on the provisioning docs page
Here are some provisioning examples for this datasource.
apiVersion: 1

datasources:
  - name: Graphite
    type: graphite
    access: proxy
    url: http://localhost:8080
    jsonData:
      graphiteVersion: "1.1"


