
Important: This documentation is about an older version. It's relevant only to the release noted, many of the features and functions have been updated or replaced. Please view the current version.
Using PostgreSQL in Grafana
Grafana ships with a built-in PostgreSQL data source plugin that allows you to query and visualize data from a PostgreSQL compatible database.
Adding the data source
- Open the side menu by clicking the Grafana icon in the top header.
- In the side menu under the
Dashboardslink you should find a link namedData Sources. - Click the
+ Add data sourcebutton in the top header. - Select PostgreSQL from the Type dropdown.
Database User Permissions (Important!)
The database user you specify when you add the data source should only be granted SELECT permissions on
the specified database & tables you want to query. Grafana does not validate that the query is safe. The query
could include any SQL statement. For example, statements like DELETE FROM user; and DROP TABLE user; would be
executed. To protect against this we Highly recommmend you create a specific postgresql user with restricted permissions.
Example:
 CREATE USER grafanareader WITH PASSWORD 'password';
 GRANT USAGE ON SCHEMA schema TO grafanareader;
 GRANT SELECT ON schema.table TO grafanareader;
Make sure the user does not get any unwanted privileges from the public role.
Macros
To simplify syntax and to allow for dynamic parts, like date range filters, the query can contain macros.
We plan to add many more macros. If you have suggestions for what macros you would like to see, please open an issue in our GitHub repo.
The query editor has a link named Generated SQL that shows up after a query as been executed, while in panel edit mode. Click on it and it will expand and show the raw interpolated SQL string that was executed.
Table queries
If the Format as query option is set to Table then you can basically do any type of SQL query. The table panel will automatically show the results of whatever columns & rows your query returns.
Query editor with example query:
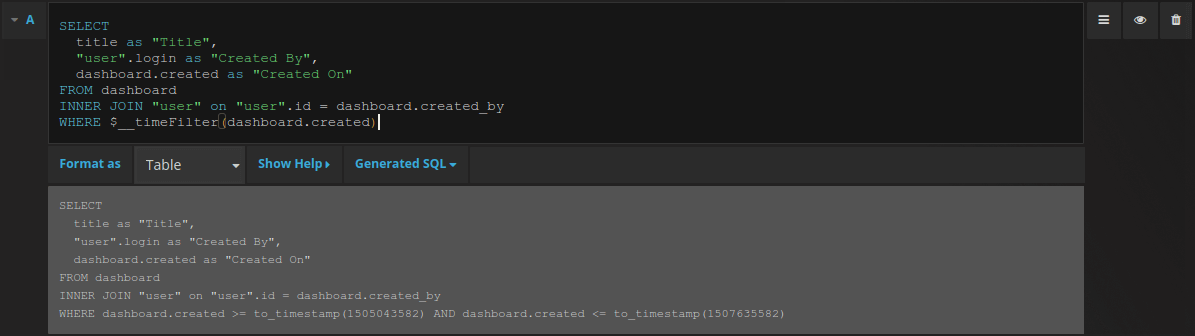
The query:
SELECT
  title as "Title",
  "user".login as "Created By",
  dashboard.created as "Created On"
FROM dashboard
INNER JOIN "user" on "user".id = dashboard.created_by
WHERE $__timeFilter(dashboard.created)
You can control the name of the Table panel columns by using regular as SQL column selection syntax.
The resulting table panel:

Time series queries
If you set Format as to Time series, for use in Graph panel for example, then the query must return a column named time that returns either a sql datetime or any numeric datatype representing unix epoch in seconds.
Any column except time and metric is treated as a value column.
You may return a column named metric that is used as metric name for the value column.
Example with metric column
SELECT
  $__timeGroup(time_date_time,'5m'),
  min(value_double),
  'min' as metric
FROM test_data
WHERE $__timeFilter(time_date_time)
GROUP BY time
ORDER BY time
Example with multiple columns:
SELECT
  $__timeGroup(time_date_time,'5m'),
  min(value_double) as min_value,
  max(value_double) as max_value
FROM test_data
WHERE $__timeFilter(time_date_time)
GROUP BY time
ORDER BY time
Templating
Instead of hard-coding things like server, application and sensor name in you metric queries you can use variables in their place. Variables are shown as dropdown select boxes at the top of the dashboard. These dropdowns makes it easy to change the data being displayed in your dashboard.
Checkout the Templating documentation for an introduction to the templating feature and the different types of template variables.
Query Variable
If you add a template variable of the type Query, you can write a PostgreSQL query that can
return things like measurement names, key names or key values that are shown as a dropdown select box.
For example, you can have a variable that contains all values for the hostname column in a table if you specify a query like this in the templating variable Query setting.
SELECT hostname FROM hostA query can return multiple columns and Grafana will automatically create a list from them. For example, the query below will return a list with values from hostname and hostname2.
SELECT host.hostname, other_host.hostname2 FROM host JOIN other_host ON host.city = other_host.cityTo use time range dependent macros like $__timeFilter(column) in your query the refresh mode of the template variable needs to be set to On Time Range Change.
SELECT event_name FROM event_log WHERE $__timeFilter(time_column)Another option is a query that can create a key/value variable. The query should return two columns that are named __text and __value. The __text column value should be unique (if it is not unique then the first value is used). The options in the dropdown will have a text and value that allows you to have a friendly name as text and an id as the value. An example query with hostname as the text and id as the value:
SELECT hostname AS __text, id AS __value FROM hostYou can also create nested variables. For example if you had another variable named region. Then you could have
the hosts variable only show hosts from the current selected region with a query like this (if region is a multi-value variable then use the IN comparison operator rather than = to match against multiple values):
SELECT hostname FROM host WHERE region IN($region)Using Variables in Queries
From Grafana 4.3.0 to 4.6.0, template variables are always quoted automatically so if it is a string value do not wrap them in quotes in where clauses.
From Grafana 4.7.0, template variable values are only quoted when the template variable is a multi-value.
If the variable is a multi-value variable then use the IN comparison operator rather than = to match against multiple values.
There are two syntaxes:
$<varname> Example with a template variable named hostname:
SELECT
  atimestamp as time,
  aint as value
FROM table
WHERE $__timeFilter(atimestamp) and hostname in($hostname)
ORDER BY atimestamp ASC
[[varname]] Example with a template variable named hostname:
SELECT
  atimestamp as time,
  aint as value
FROM table
WHERE $__timeFilter(atimestamp) and hostname in([[hostname]])
ORDER BY atimestamp ASC
Annotations
Annotations allow you to overlay rich event information on top of graphs. You add annotation queries via the Dashboard menu / Annotations view.
An example query:
SELECT
  extract(epoch from time_date_time) AS time,
 metric1 as text,
  concat_ws(', ', metric1::text, metric2::text) as tags
FROM
  public.test_data
WHERE
$__timeFilter(time_date_time)Alerting
Time series queries should work in alerting conditions. Table formatted queries is not yet supported in alert rule conditions.
Configure datasource with provisioning
It’s now possible to configure datasources using config files with Grafanas provisioning system. You can read more about how it works and all the settings you can set for datasources on the provisioning docs page
Here are some provisioning examples for this datasource.
apiVersion: 1

datasources:
  - name: Postgres
    type: postgres
    url: localhost:5432
    database: grafana
    user: grafana
    secureJsonData:
      password: "Password!"
    jsonData:
      sslmode: "disable" # disable/require/verify-ca/verify-full

