
How Dell successfully migrated to Grafana Cloud and consolidated its observability in the process
While some monitoring tools excel at a specific task, observability works best when you have a holistic view of your system. You need a platform capable of working with all of your telemetry collectively, otherwise you can end up with a complex, inefficient, and expensive collection of incongruent, siloed tools.
That’s what one team at Dell Technologies realized before they made a switch to Grafana Cloud last year.
In an ObservabilityCON On the Road 2024 presentation, Brian Murphy, a staff site reliability engineer at Dell Technologies, recounted the change from on-premises observability and IT management platform SolarWinds and how his company was able to consolidate its observability tooling without losing functionality.
Dell even gained helpful tools in the process, too. Now, they’re using Grafana Cloud’s Adaptive Metrics feature to save money and only capture the metrics they need. “You don’t have to look at junk that’s not useful,” Murphy said. “And it’s just so much easier to work through.”
Grafana OnCall, meanwhile, made problem-solving easier for 13,000 engineers and cut down on inbox clutter. And team members across the company — including executives — benefitted from access to smart, useful dashboards.
Note: The Dell Technologies session from ObservabilityCON on the Road 2024 is now available to watch on demand. You can check out the full session on YouTube below.

A lot of ground to cover, and just one tool to do it with
Murphy works in Dell’s internal-facing Infrastructure Solutions Group (ISG). More specifically, he works in a group known as Tech Ops 2.0 that focuses on improving reliability and MTTx, and making sure their partners are “happy and successful.” They also own a number of IT assets, including:
- The company’s “North Star tooling,” which includes Jira, Confluence, GitHub Enterprise, Jenkins, and more
- A build pipeline
- Dell’s globally distributed data centers
- Its Kubernetes clusters, plus all the hardware and the networking that goes along with it
- An internal cloud
- 400 switches, which are monitored by a few teams across 10 different sites around the globe
Previously, Dell used SolarWinds to keep tabs on everything. And though it delivered on network performance monitoring and had features teams were using, there were downsides. “It’s very niche. It does one thing,” Murphy explained.
Teams were using SolarWinds sparingly, if at all. There was also a matter of alerts related to issues in one region being blasted out to teams thousands of miles away. All of that noise was “a big problem,” he said. “We want to reduce noise.”
There was also the challenge of self hosting, as well as significant roadblocks in combining their telemetry data. “It didn’t integrate with anything else,” Murphy explained. “We didn’t have it talking to anything else. If you wanted to do anything that wasn’t in SolarWinds, you had to switch tabs. You had to log into some other system. It was a silo.”
Time for a change
Dell opted not to renew their contract with SolarWinds. Murphy viewed it as the perfect opportunity to talk about “a new way forward in observability,” and after assessing other products, they decided that Grafana Labs was the way to go. “It was going to bring the things together to break down those walls, to break down the silos,” he said.
By talking to the distributed teams around the world, Murphy’s group was able to get a handle on use cases — what the engineers did in SolarWinds and what they still needed. Within a few months, they were using Grafana to push out new agents and create dashboards and alerts. Before making the official migration, engineers were trained and got comfortable with the new tools, so the big rollout was quick and Murphy’s team met their transition deadline.
“Hitting the deadline was good,” he said, “but more importantly to me is that we didn’t lose anything. Our observability of the hardware and the network was maintained.” None of his team’s partners or customers even noticed the change. “There was zero gap in reliability and there was no negative impact. So to me, that was the big win moment.”
A new, unified way forward with Grafana Cloud
With Grafana Cloud, the Dell teams went from a tool that did one thing to a platform with multiple tools that could do so much more.
“We actually got information that we didn’t have access to before, which was cool,” Murphy said.
They built out SNMP exporters and agents, and unlocked the node exporter and some of the black box exporters. They also set up alerts, notifications, persona-based dashboards, and began adopting more parts of Grafana Cloud. For example, they used the Adaptive Metrics feature to remove scores of unused metrics.
Murphy said his team simply wrote up some rules and stopped shipping the unused metrics. The image below, from a Grafana dashboard, is displaying metrics over time. The green line is what the company is saving, he said. “The yellow one is the metrics that we’re saving plus what we’re not. So the yellow line is the things that we’re getting aggregated away.”

They’re also using private probes in Grafana Cloud Synthetic Monitoring to keep tabs on their cloud environments. “It gives us a great view of the degradation for our network traffic. And when we do see problems, these graphs help us.”
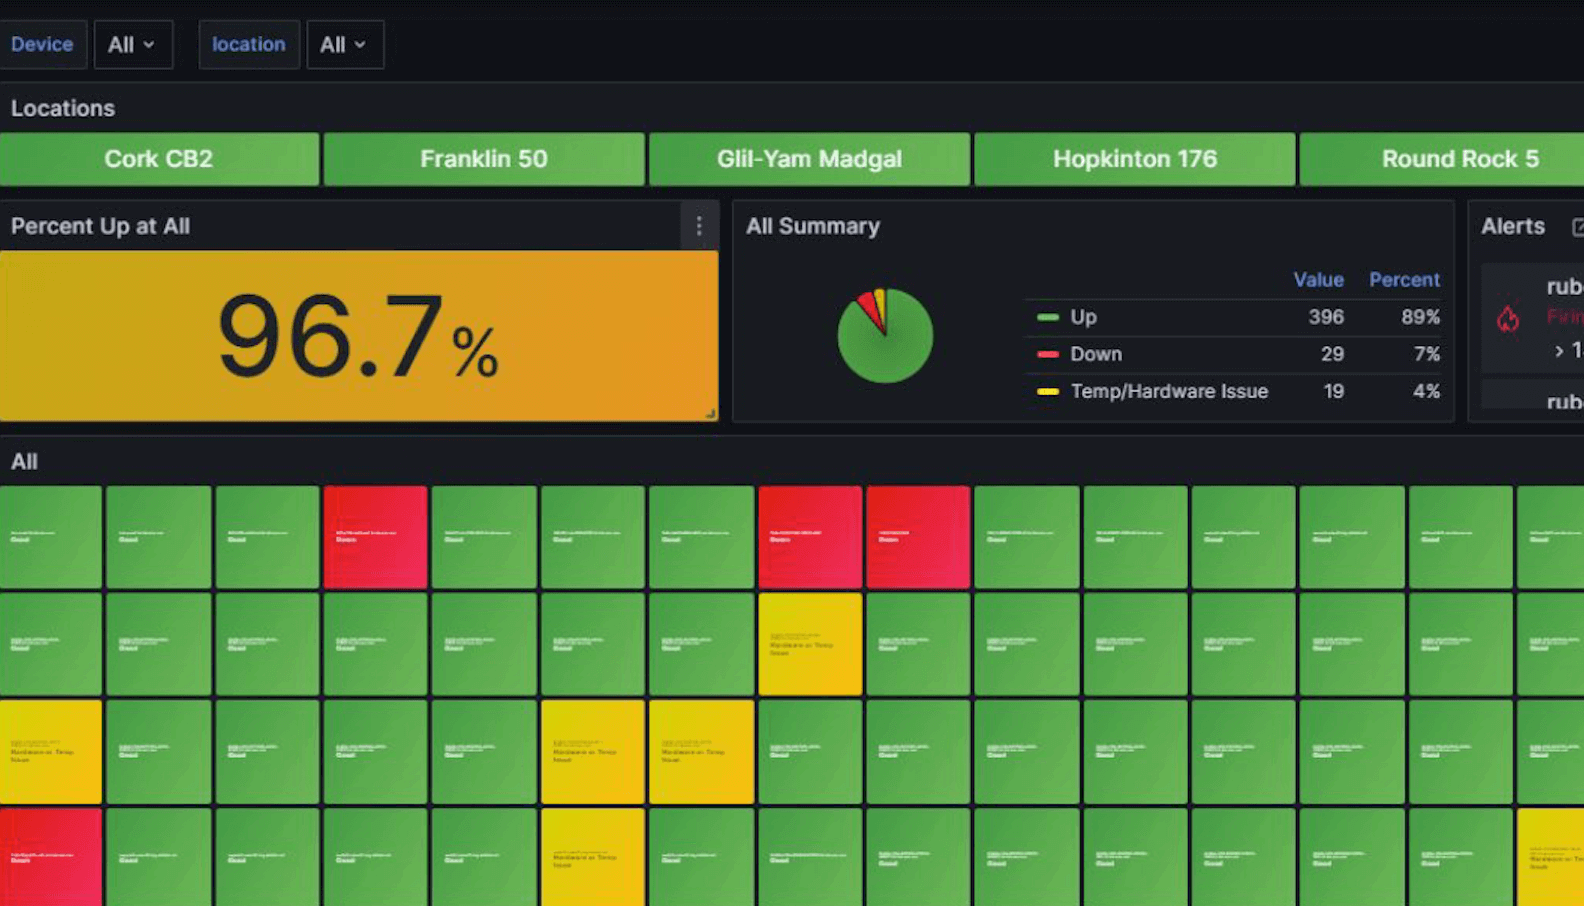
On top of all that, Murphy’s team created dashboards for company executives who “like to know how things are going within the world that we live in,” and also for the support team members who use Grafana OnCall to fix problems when they arise. “Executives seem to be happy with how they look,” he said. “The teams are happily using them, solving problems, making things happen.”

Collectively, Grafana Cloud has become the “first pane of glass for incidents” at Dell, Murphy said. In fact, when someone receives an alert, the runbook says the first place to seek out information is a Grafana dashboard. “And then that way, they’re not switching between six different devices unless they have to.” He said they are also leveraging the OnCall integration, which means there are fewer email blasts being received by people who don’t need to get them.
Having one less service to support and maintain has also freed up people who were “keeping, feeding, and nurturing the SolarWinds instances” to work on “cooler, newer, better, more fun, more interesting” things.
What’s next
Murphy said Dell is actively migrating 40 or 50 other teams and services to Grafana Cloud, including Artifactory, JIRA, Confluence, their Kubernetes, and OpenShift. The goal is to bring everyone under the same roof so users can get away from naive alerts and make “really smart, qualified alerts.”
The company has a new team that monitors thousands of other switches. “Guess what?” Murphy said. “We’re just bringing them the same dashboards and they’re getting the value. We just added a data source selector. That was it. That’s all we had to do to make these data, to make these dashboards cool and new for them.”
Going forward, he said they plan to do more SLO-based alerting — for example, when a fan is down — to focus on experience. They’re also looking at using Grafana Beyla, an open source eBPF-based auto-instrumentation tool. And following the success they’ve had with Adaptive Metrics, they’re eager to try Adaptive Logs, which is currently in the works. “We send a lot of logs, a lot of logs,” he said. And they’ll continue to onboarding more teams and more services to Grafana Cloud.
Grafana Cloud is the easiest way to get started with continuous profiling, metrics, logs, traces, and dashboards. We have a generous forever-free tier and plans for every use case. Sign up for free now!

