From chaos to clarity with Grafana dashboards: How video game company EA monitors 200+ metricsDashboardGrafanaGrafanaCon
One platform for logs, metrics, traces, profiles, and OpenTelemetry: Inside Booking.com’s move to Grafana CloudMimirOpenTelemetry
How a cooking platform whipped up a new observability plan with Grafana CloudCommunityAdaptive Metrics
How LATAM Airlines uses Grafana Cloud for real-time observability that improves customers’ experiencesObservabilityGrafana CloudGrafana SLO
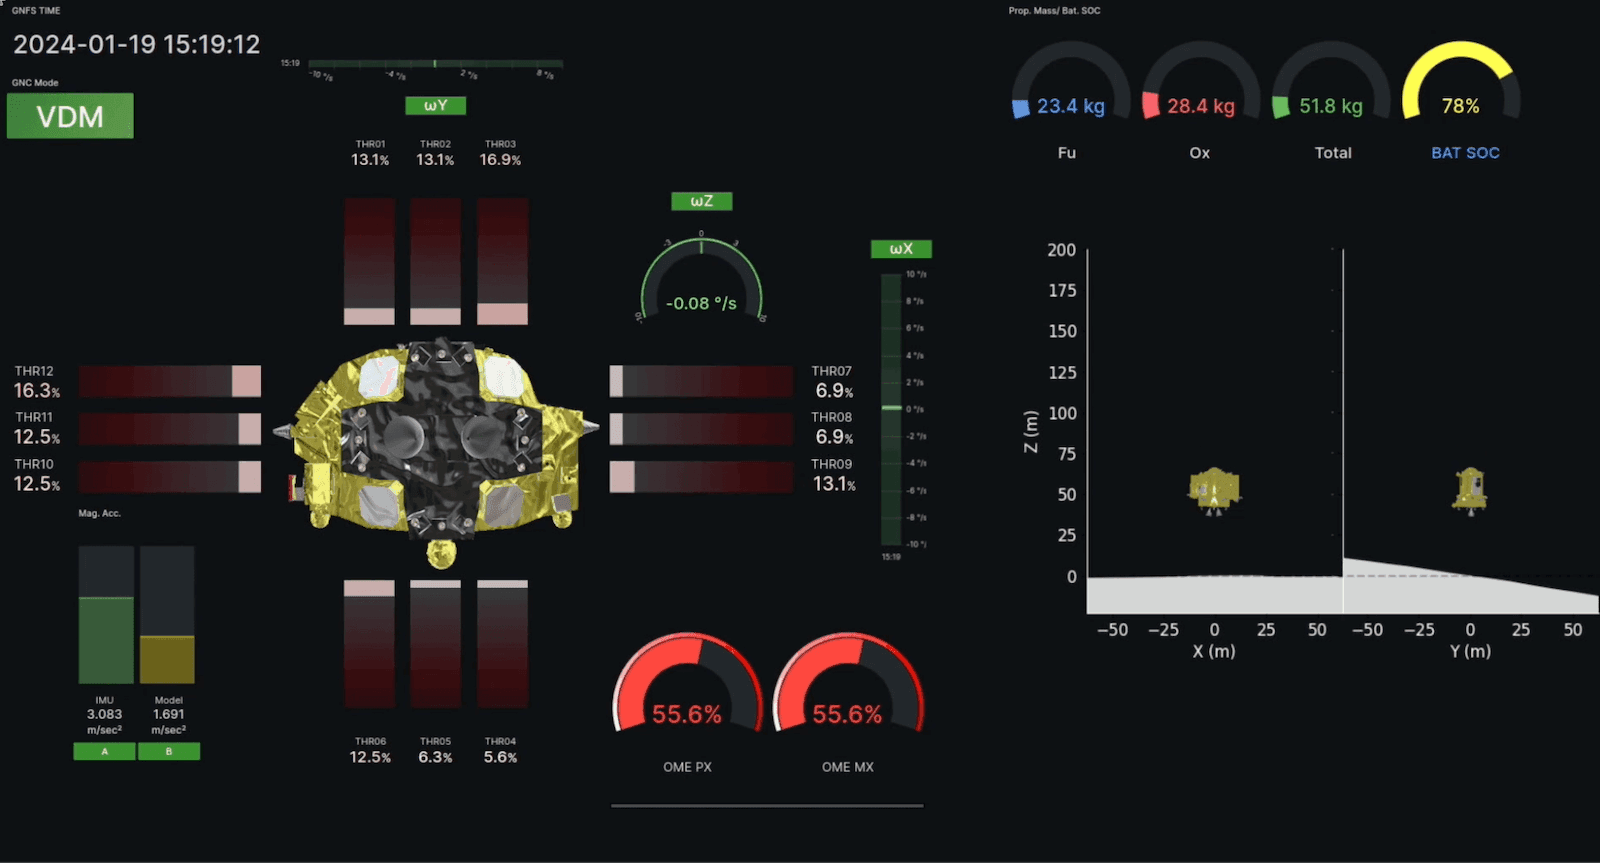
How Japan’s space agency used Grafana to monitor its first moon landing in real timeDashboardGrafanaMonitoring
How Dell successfully migrated to Grafana Cloud and consolidated its observability in the processGrafana CloudAdaptive Metrics
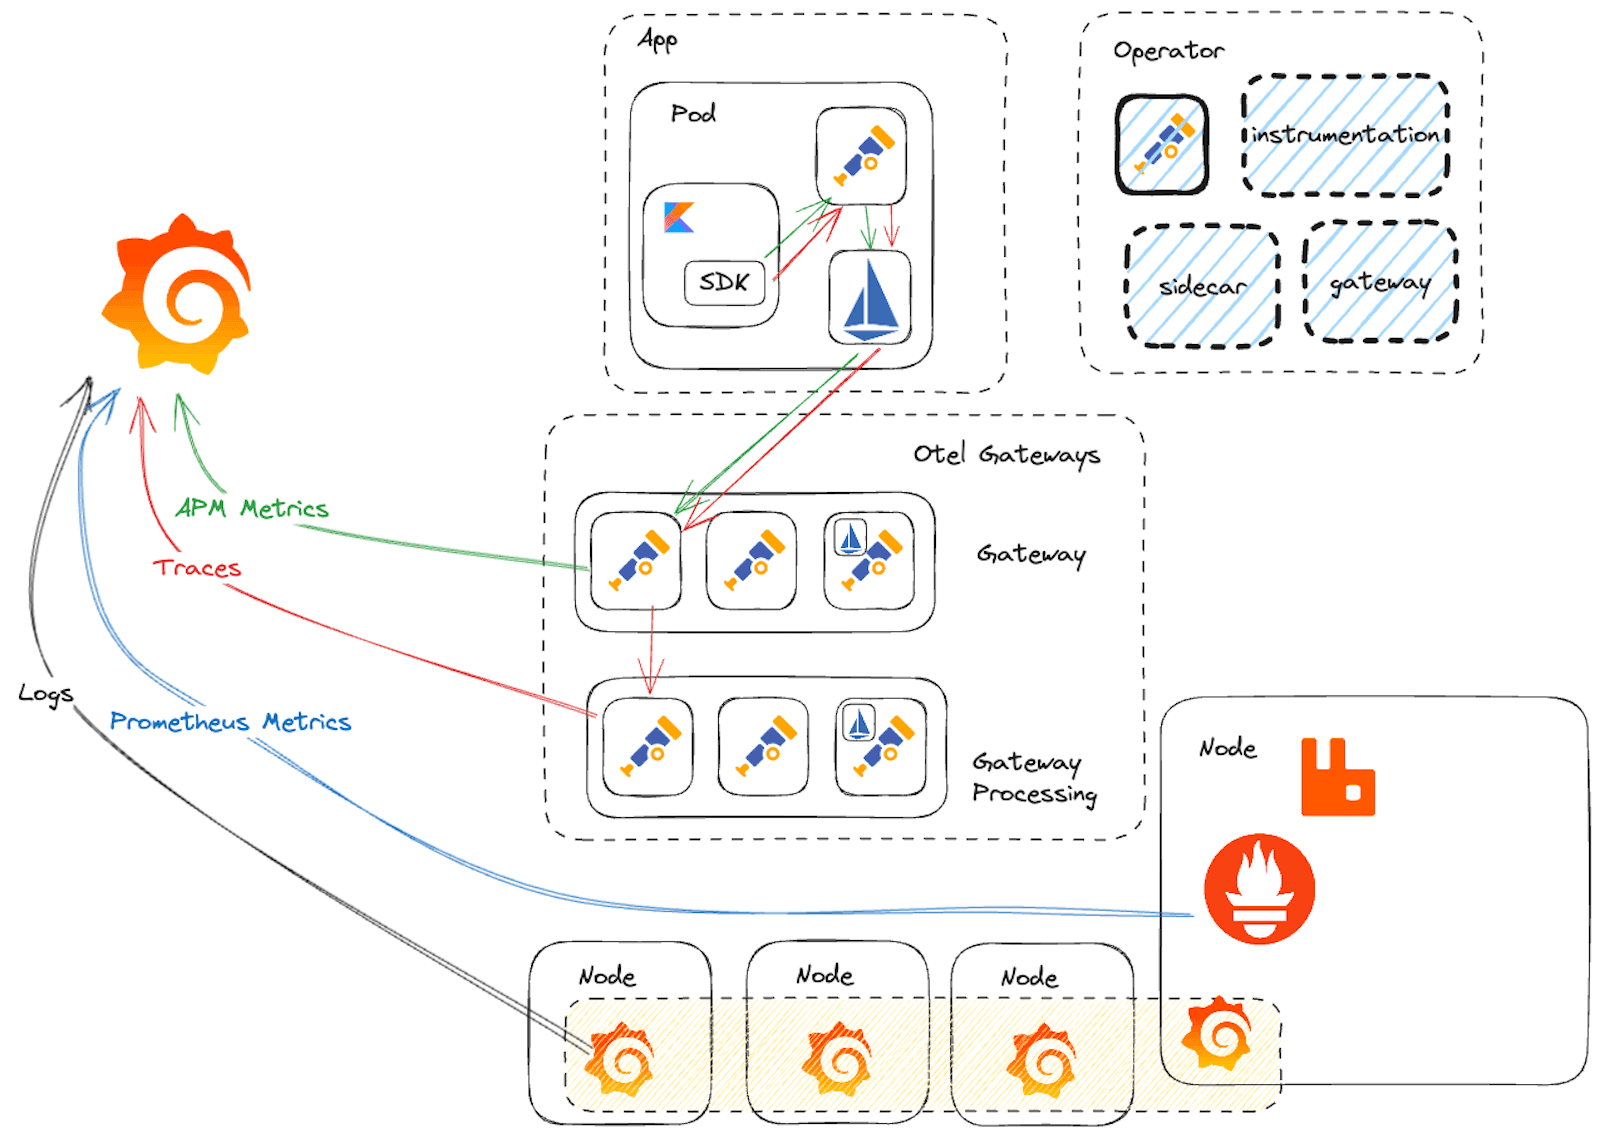
How ComplyAdvantage built a more flexible observability strategy with OpenTelemetry and Grafana CloudOpenTelemetryGrafana CloudObservability
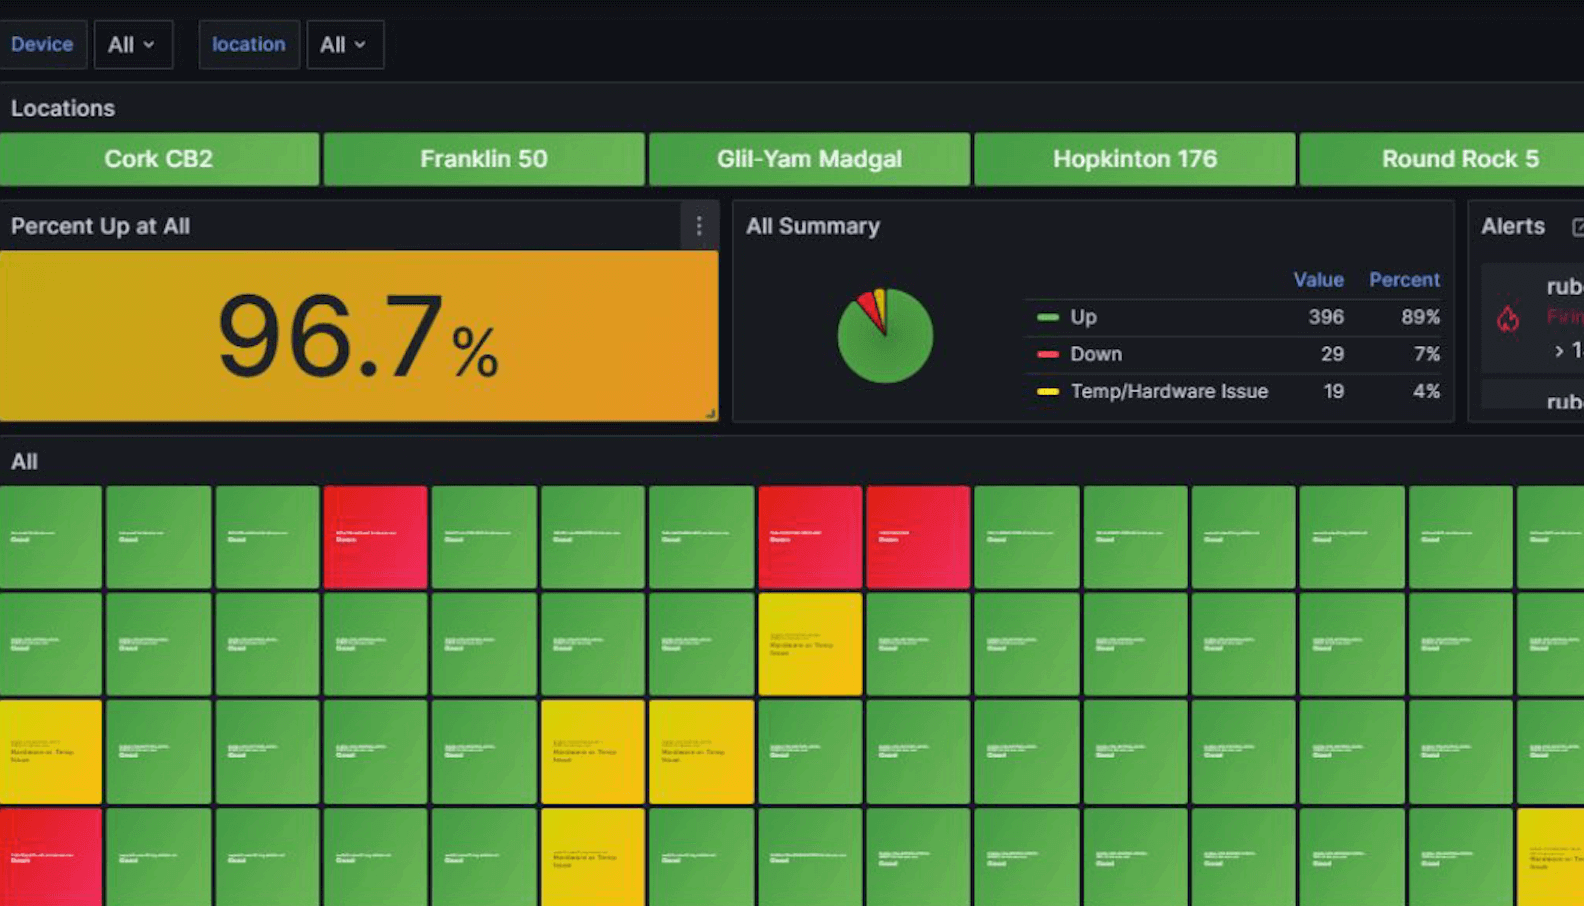
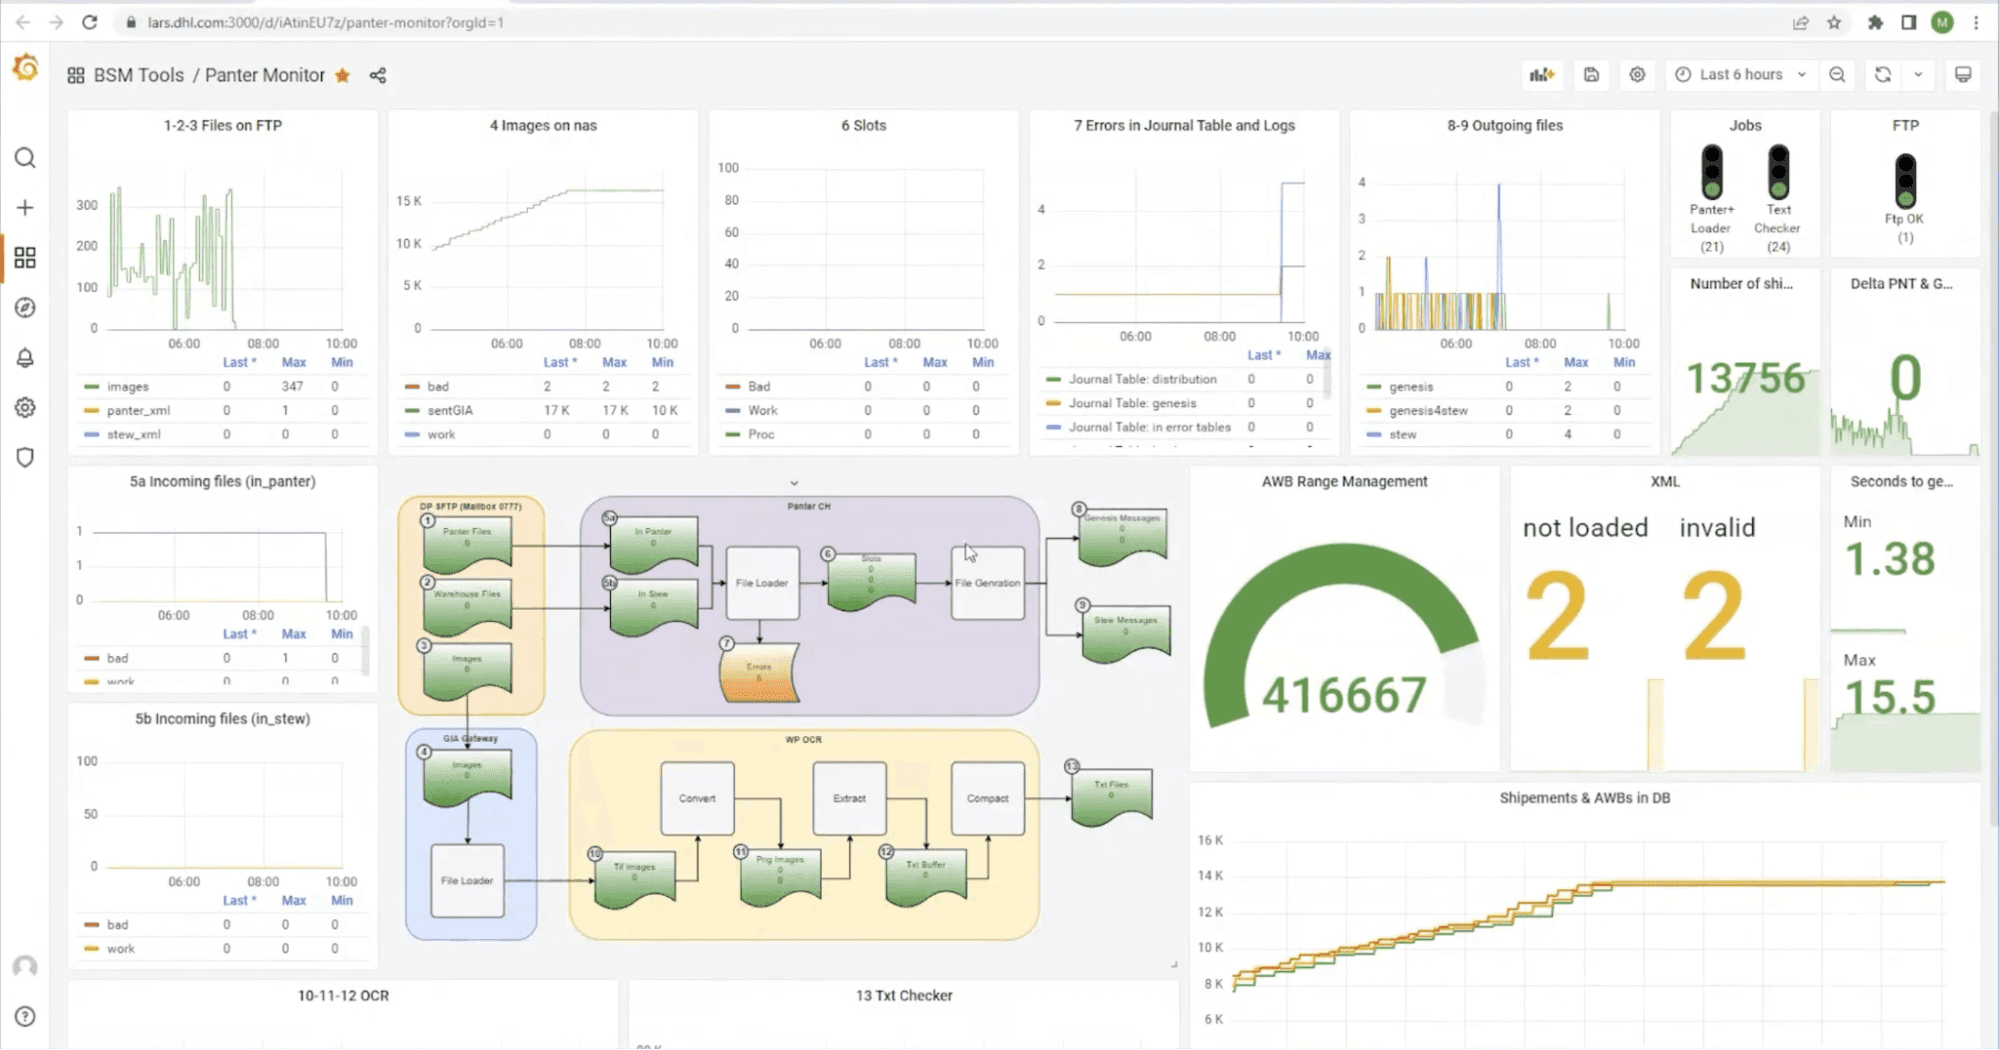
How shipping/third-party logistics companies reduce MTTR and increase uptime with the Grafana LGTM StackCommunityGrafanaGrafana Cloud
Troubleshoot in less than 60 seconds with Grafana: Inside NOS’s observability stackGrafanaPrometheusLokiOpen Source
How Denmark’s Energinet uses Grafana Enterprise to monitor underwater energy cables — and do detective workGrafana EnterpriseGrafana
Using Grafana and machine learning to analyze microscopy images: Inside Theia Scientific’s workGrafanaIoT
GrafanaCONline 2022 Day 4 recap: Grafana Labs technical docs, citizen science with Grafana Cloud, load testing with Grafana k6, and moreGrafanaCon
GrafanaCONline 2022 Day 3 recap: Alerting in Grafana 9, Loki developments, dashing dashboards, and more!Grafana CloudGrafanaLokiIoTUXDashboard
How AgriTech used IoT and Grafana to help industrial hemp farmers hit a new production highIoTGrafana