
Reducing MTTR and tracking SLAs with Grafana Cloud
Attracting and retaining top developer talent is a No. 1 priority for a lot of companies these days, including location technology company TomTom. As both the builder of the world’s largest developer community and an employer of thousands of developers, TomTom is always looking for developer-friendly tools to help their employees feel productive, efficient, and inspired.
In his recent ObservabilityCon 2021 talk, “How TomTom is improving developer experience by building an observability-centric culture with Grafana Cloud,” Site Reliability Engineer Carl Meert shared how the developer teams at TomTom have benefited from implementing Grafana Cloud, from reducing MTTR to fostering camaraderie through knowledge sharing sessions based on Grafana dashboards.
Reducing MTTR with Grafana Cloud
TomTom built its vast developer community by making 19 trillion routing and location data points available over APIs and SDKs. Developing, maintaining, and deploying those API endpoints is a huge job for the developers at TomTom. And they’re supported by Meert’s SRE team, whose mission is to provide observability and reliability expertise for those developers.
A few years ago, the team was looking into ways to reduce MTTR. At the time, they didn’t have visibility into the status of their services across the board. “Different engineering teams had a few views into their own services, but they weren’t shareable,” said Meert. “Some teams used Prometheus, others used different monitoring tools, and often they were conflicting. This was actually a big issue.”
Their first move toward better visibility? Introducing Grafana Cloud to manage visualize all their various business metrics. “It didn’t take much time or effort to bring all these different data sources into a single dashboard,” said Meert. “From problem statement to having our first business dashboard up and running was two weeks.” That dashboard provided an end-to-end view of the business service and assisted in handling incidents and tracking SLAs.
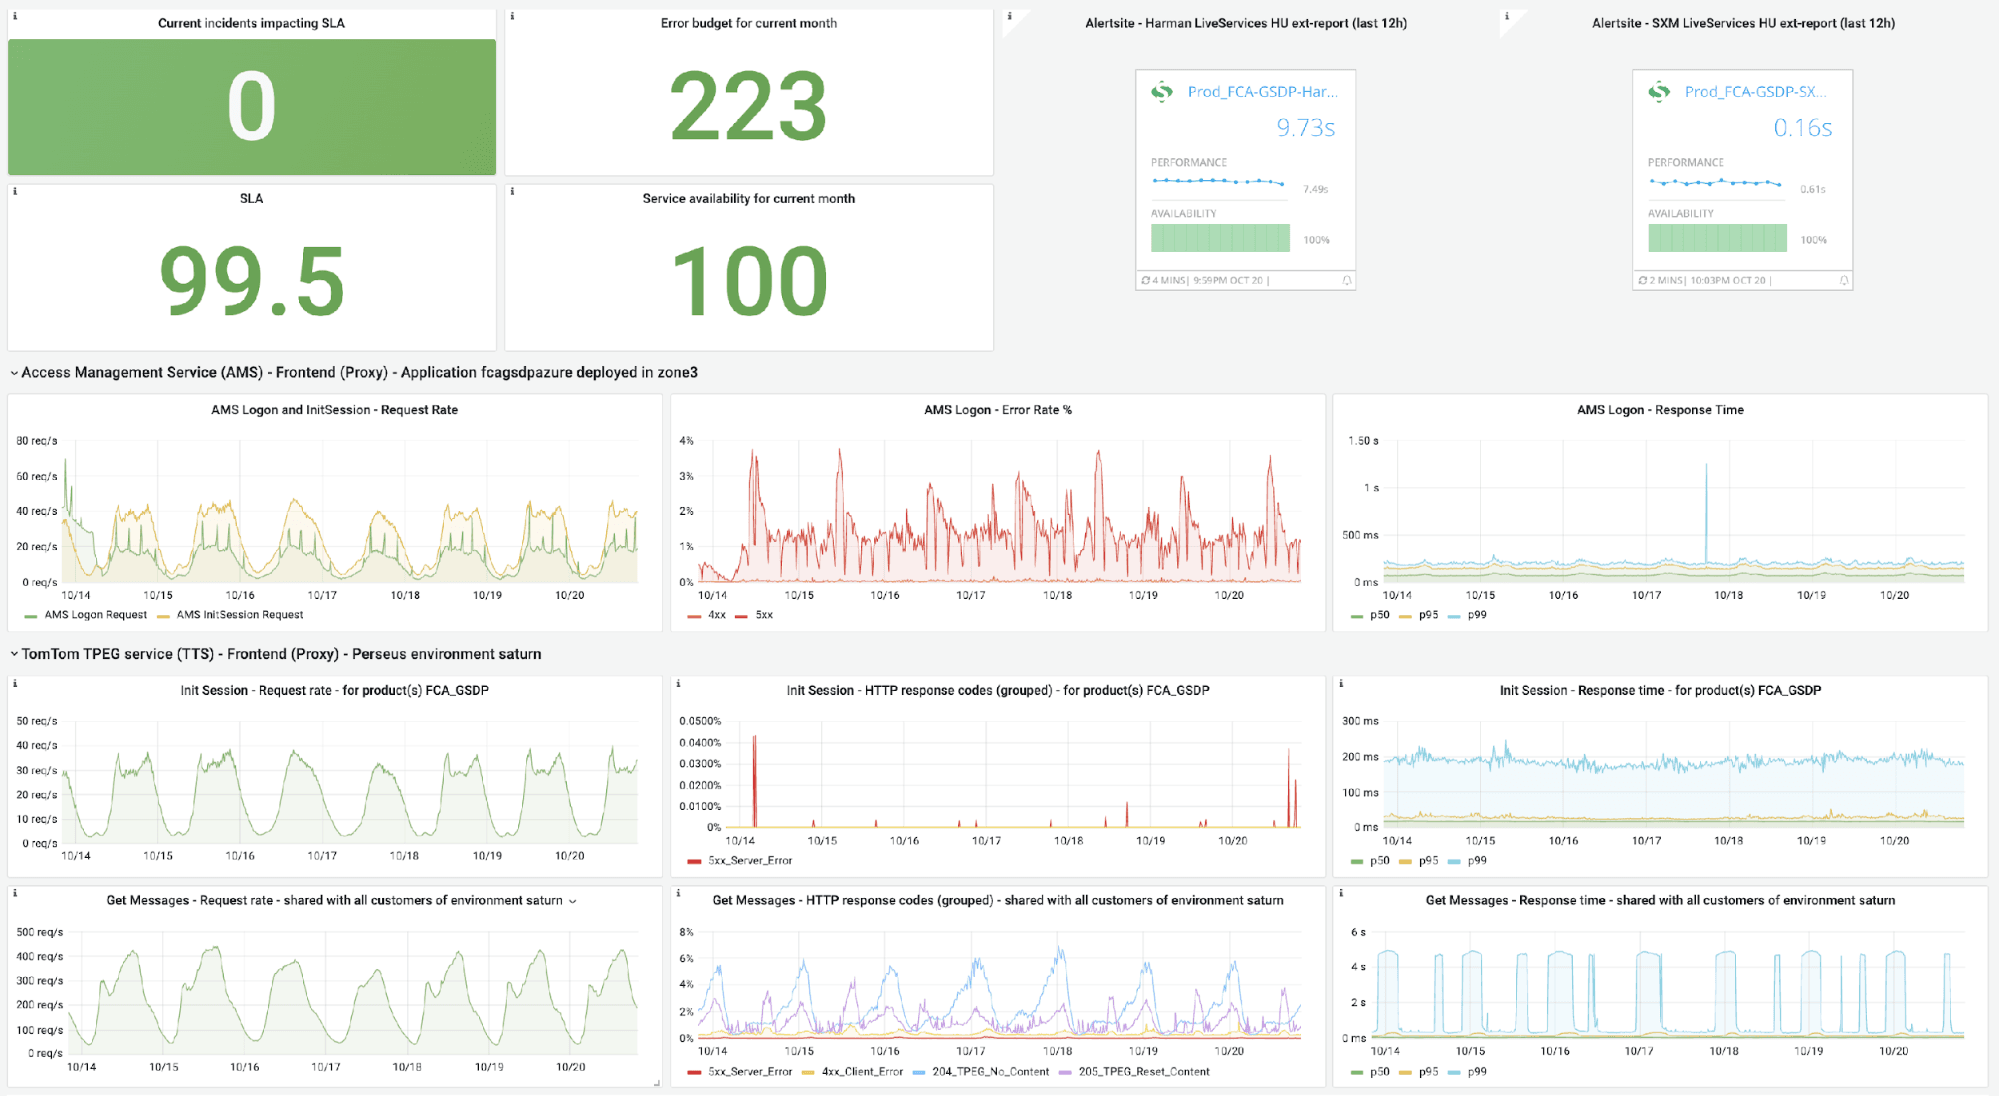
Above: TomTom business dashboard tracking SLAs, blackbox monitoring metrics, and service statuses.
Increasing collaboration with dashboards
With their business dashboards in place, the TomTom team decided to introduce weekly technical operational reviews. These meetings regularly bring together teams to discuss various customer experience metrics and use Grafana as the jumping off point to analyze performance.
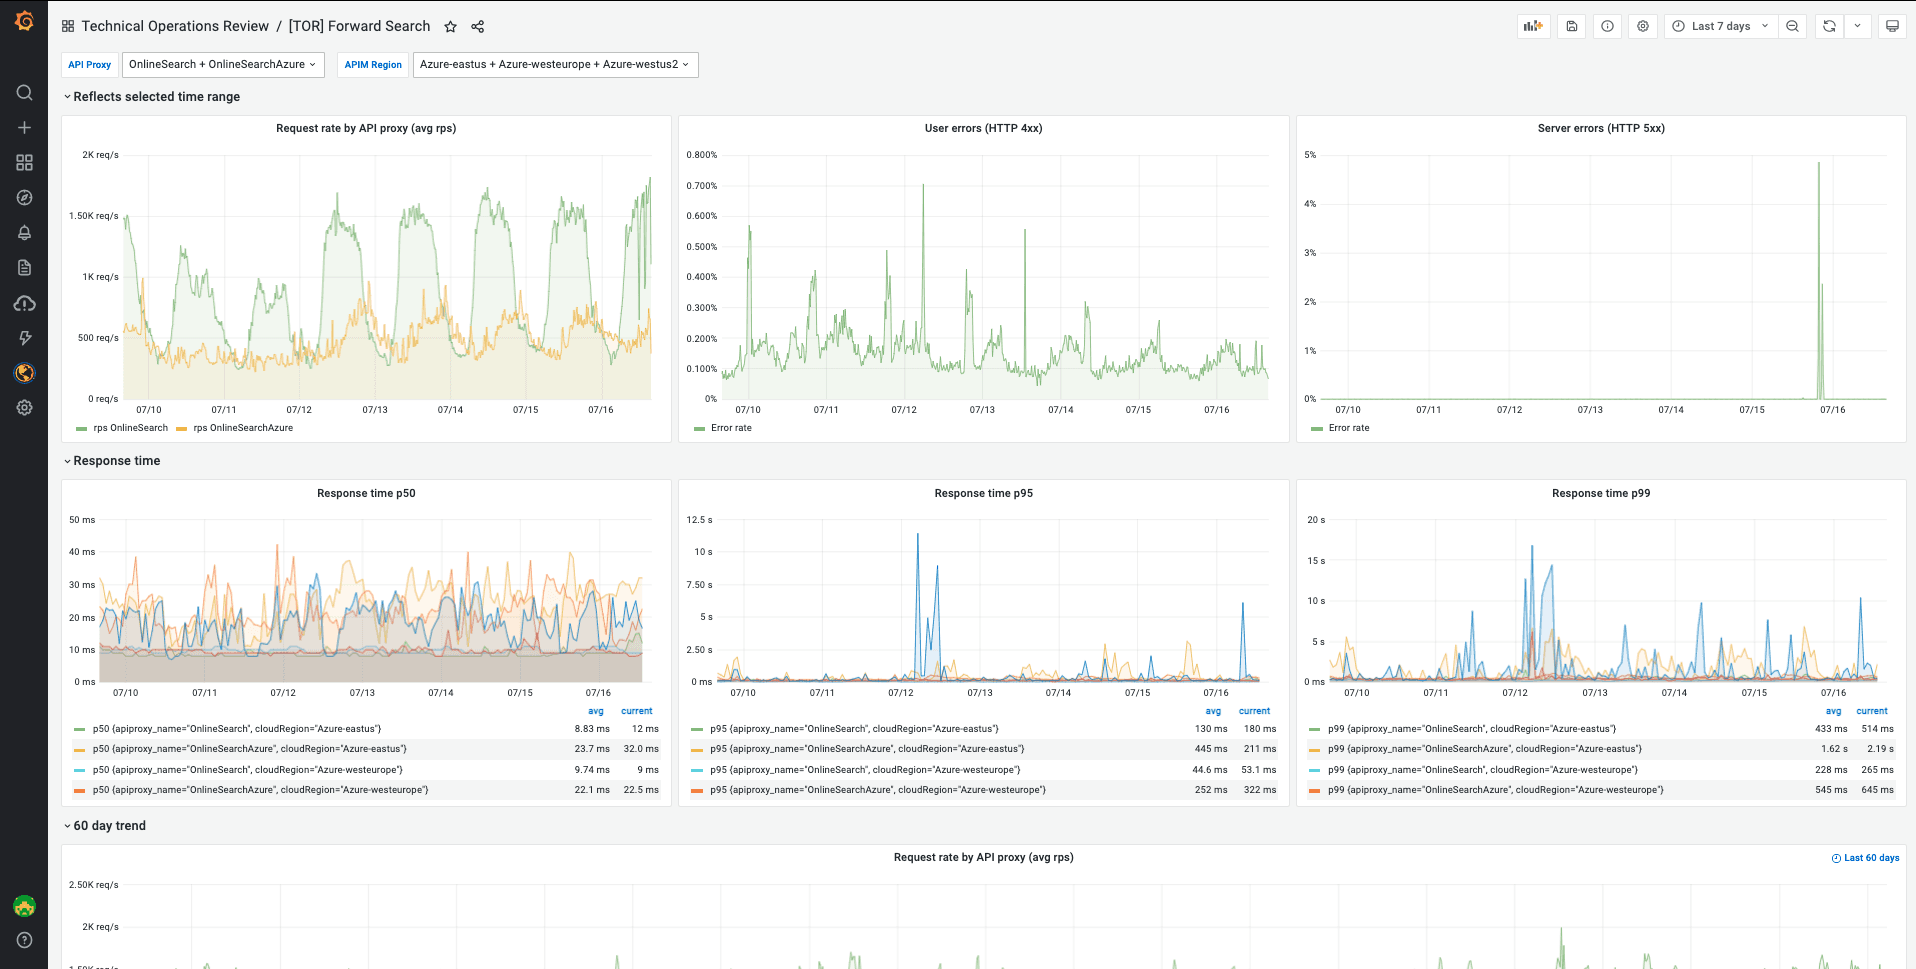
Above: TomTom technical operational review dashboards visualize customer experience metrics and map the normal behavior of a service to help identify anomalies.
It’s a huge benefit for the engineers at TomTom, said Meert. “They learn what a normal behavior is for their service, and if there are any anomalies, they can go deeper into that and discuss it,” he said. The engineers help each other, and it’s an opportunity for knowledge sharing. And since the dashboards are all built on Grafana Cloud, they’re shareable.
Implementing synthetic monitoring for full visibility
Not long after implementing Grafana Cloud, Meert’s team started to investigate synthetic monitoring. “At TomTom, we have nine different tools that we use. Not everyone has access to those tools, so we could use more visibility there,” said Meert. The developer teams are now leveraging Grafana Cloud’s synthetic monitoring capabilities, from embedding metrics into existing Grafana dashboards to configuring Grafana as code.
With Grafana Cloud helping to track SLAs, reduce MTTR, and foster an observability-centric culture at TomTom, Meert is already looking forward to what’s next. In addition to expanding their use case into incident response, “we’re doing a lot with distributed tracing and building a proof of concept for bringing data into Grafana Tempo,” said Meert.
And he has no doubt there will be more functionalities to consider: “We see regular features appearing all the time, which for us has been a pleasant surprise and a good experience.”
Learn more about TomTom’s weekly technical operational reviews and see more of their dashboards by watching the full session. All our sessions from ObservabilityCON 2021 are now available on demand.
Interested in learning more about Grafana Cloud? We have a generous forever-free tier and plans for every use case — sign up now!

