Reducing data center carbon emissions with Hardware Sentry, Grafana, and OpenTelemetryObservabilityOpenTelemetryOpen SourceCommunityGrafana
How to monitor SLOs with Grafana, Grafana Loki, Prometheus, and Pyrra: Inside the Daimler Truck observability stackGrafanaConCommunityLokiPrometheus
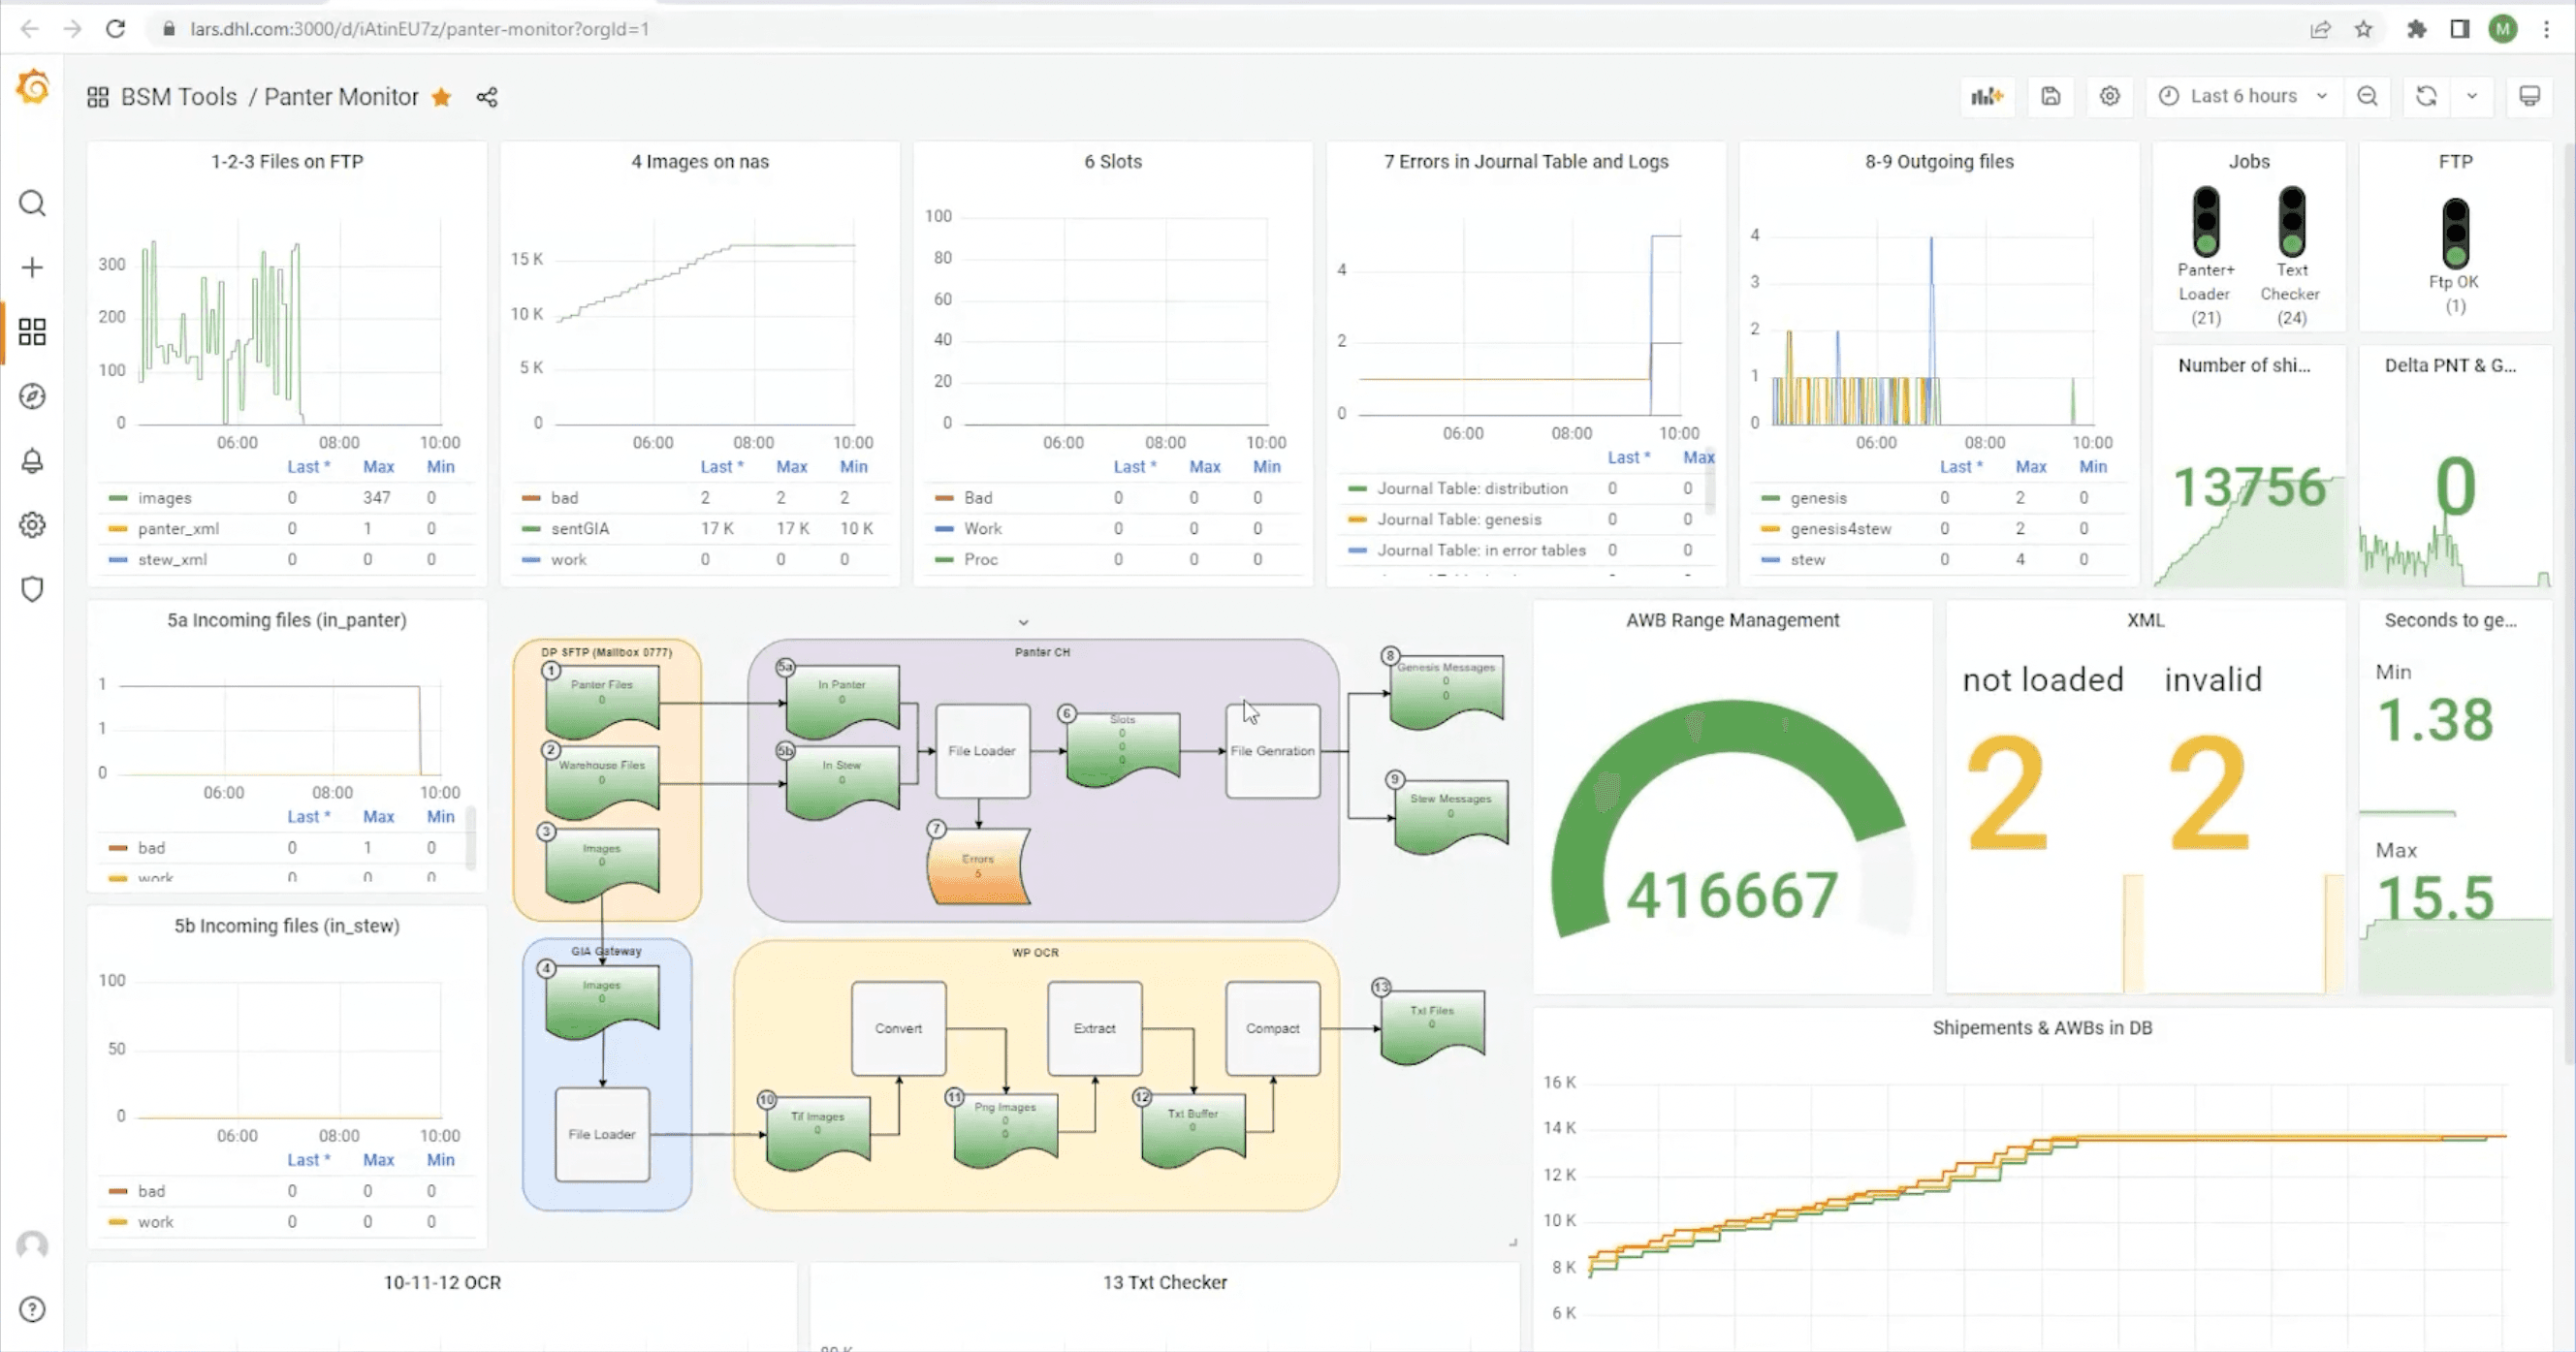
Reduce MTTR with Grafana, Grafana k6, and Prometheus: Inside DHL’s observability stackCommunityk6PrometheusGrafanaGrafanaCon
How Wells Fargo modernized its observability stack with Grafana Enterprise and Grafana CloudEventsGrafana Cloud
Reduce mean time to hello world with OpenTelemetry, Grafana Mimir, Grafana Tempo, and Grafana: Inside Adobe’s observability stackCommunityEvents
Reduce MTTR and improve UX with Grafana Enterprise: Inside Optum’s observability stackCommunityGrafana Enterprise
Building Grafana dashboards for a large-scale deployment in a tight timeline: Inside Cisco LiveGrafanaCon
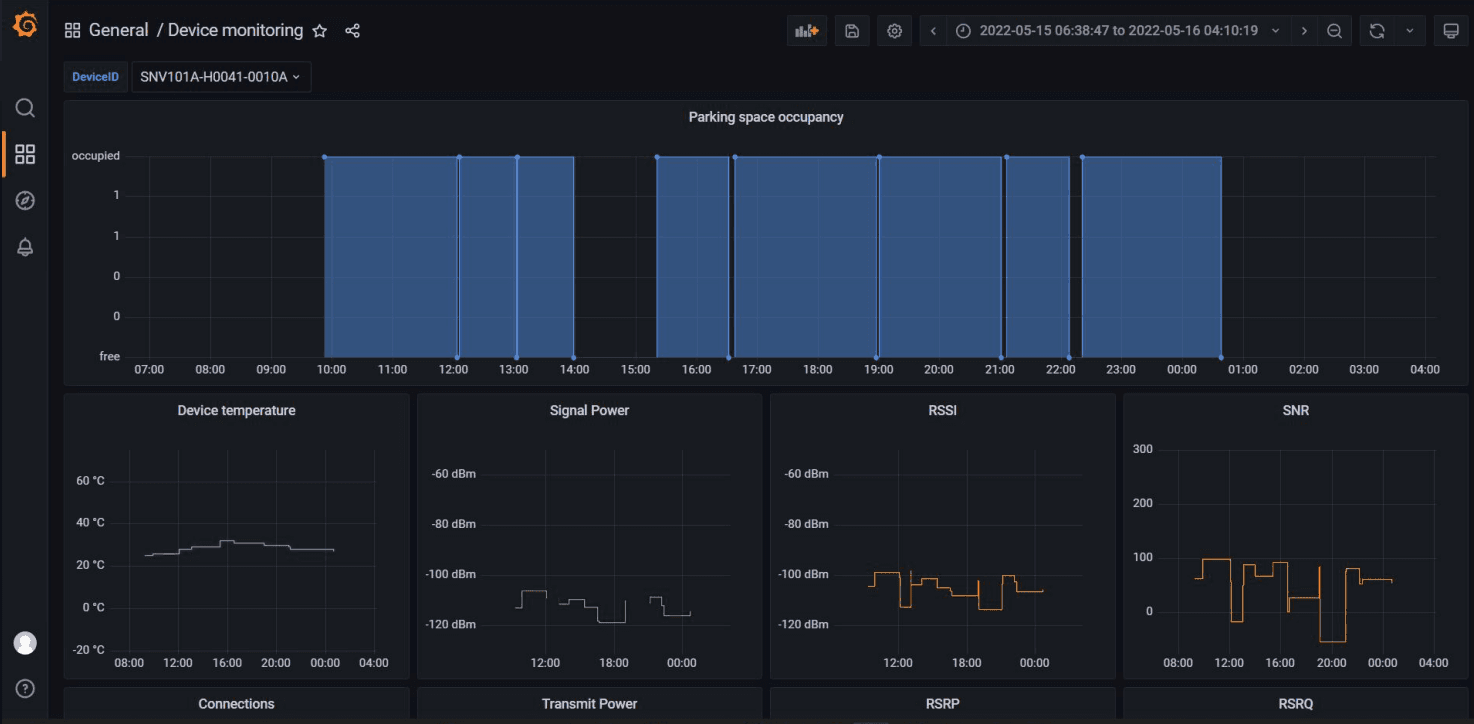
Monitoring smart city IoT devices with Grafana and Grafana Loki: Inside the Fuelics observability stackGrafanaCon
How to improve uptime with real-time monitoring, Grafana dashboards, and Grafana Loki: Inside Dish Network’s observability stackEvents
How real-time Grafana dashboards and alerts combat climate change: Inside Apeel Sciences observability stackGrafanaConIoT