Grafana Cloud Migration Assistant: from self-hosted to the cloud in minutes
The Grafana Cloud Migration Assistant is a powerful yet intuitive tool designed to streamline your migration from Grafana OSS or Grafana Enterprise....
Read more
end-to-end solutions
Opinionated solutions that help you get there easier and faster
monitor infrastructure
Out-of-the-box KPIs, dashboards, and alerts for observability
visualize any data
Instantly connect all your data sources to Grafana
Opinionated solutions that help you get there easier and faster
Instantly connect all your data sources to Grafana
Getting started with managing your metrics, logs, and traces using Grafana
Learn how to unify, correlate, and visualize data with dashboards using Grafana.
The Grafana Cloud Migration Assistant is a powerful yet intuitive tool designed to streamline your migration from Grafana OSS or Grafana Enterprise....
Read more
With our new integrated AI agent you can write in natural language to ask observability questions, see certain data, build dashboards, and make...
Read more
Prometheus native histograms offer higher resolution and precision. They're also easier to instrument and you can use them to combine and manipulate...
Read more
Explore the factors that lead to Ingress NGINX Controller metric growth and practical strategies to mitigate the issue while still retaining essential...
Read more
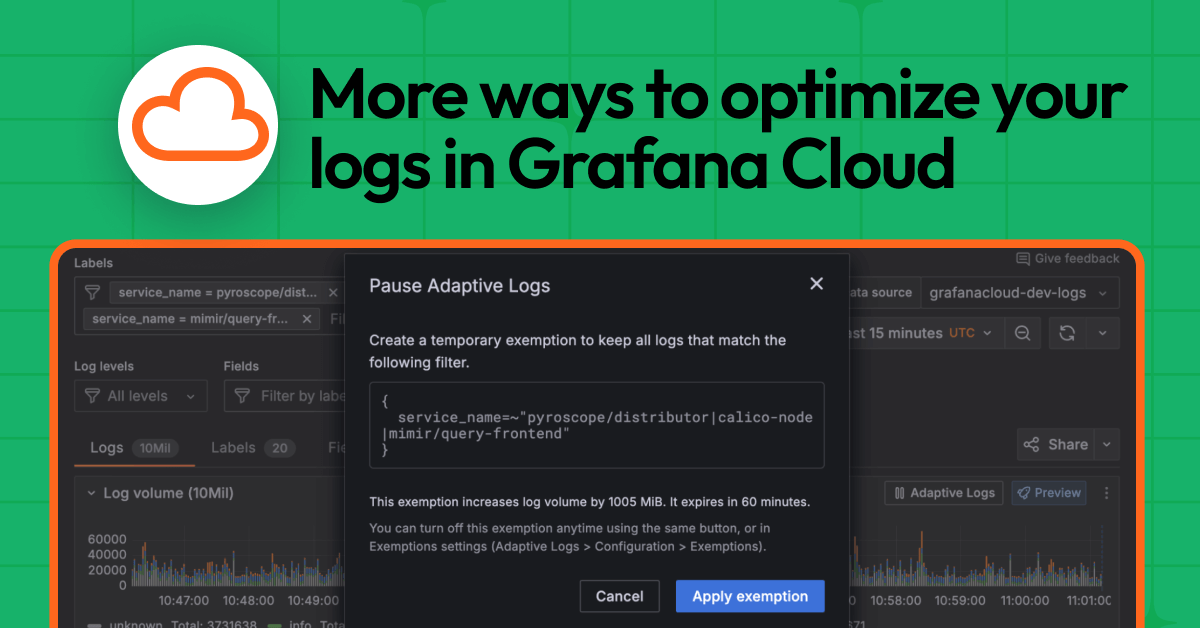
Check out these new features to help reduce toil, apply recommendations with precision, and confidently optimize your log ingestion while still...
Read more
No green thumb? No problem. Here's a simple IoT project to visualize the health of your plants using Arduino, Prometheus, and Grafana Cloud.
Read more
It’s been a big month for Grafana Cloud updates, with a range of new features rolling out across Grafana Cloud k6, Kubernetes Monitoring, Frontend...
Read more
From cold starts to pole position: Learn how to observe Lambda with OpenTelemetry and Grafana Cloud, and build a sample app for monitoring the F1...
Read more
Through standardized tagging and a migration to Grafana Cloud, the SpotOn engineering team transformed its observability strategy, ditching complexity...
Read more
We have some big Grafana Cloud updates to share this month, including a new Grafana Cloud IRM application and the general availability of Fleet...
Read more
Advanced options for storage observability and an easier way to create alerts are just a few of the many recent enhancements we’ve made to Kubernetes...
Read more
After an extensive incident review, we want to explain what went wrong, how it was resolved, and what we are doing to prevent something similar...
Read more
Fleet Management, our centralized control plane for managing observability collectors at any scale, is now generally available with a catalog of...
Read more
LATAM Airlines uses Grafana Cloud for real-time observability that improves customers' experiences
Read more
Learn how to use Grafana Cloud to monitor a Google Cloud Run service with multi-window, multi-burn-rate alerts.
Read more

No credit card needed, ever.
Gain insight into unused metrics and optimize metric cardinality with the new cardinality management dashboards and Adaptive Metrics