Visualization and monitoring integrations
Visualization and monitoring integrations
/
Monitor TensorFlow ServingMonitor TensorFlow Serving easily with Grafana
Easily monitor TensorFlow Serving, an open source platform for machine learning, with Grafana Cloud’s out-of-the-box monitoring solution. The Grafana Cloud forever-free tier includes 3 users and up to 10k metrics series to support your monitoring needs.

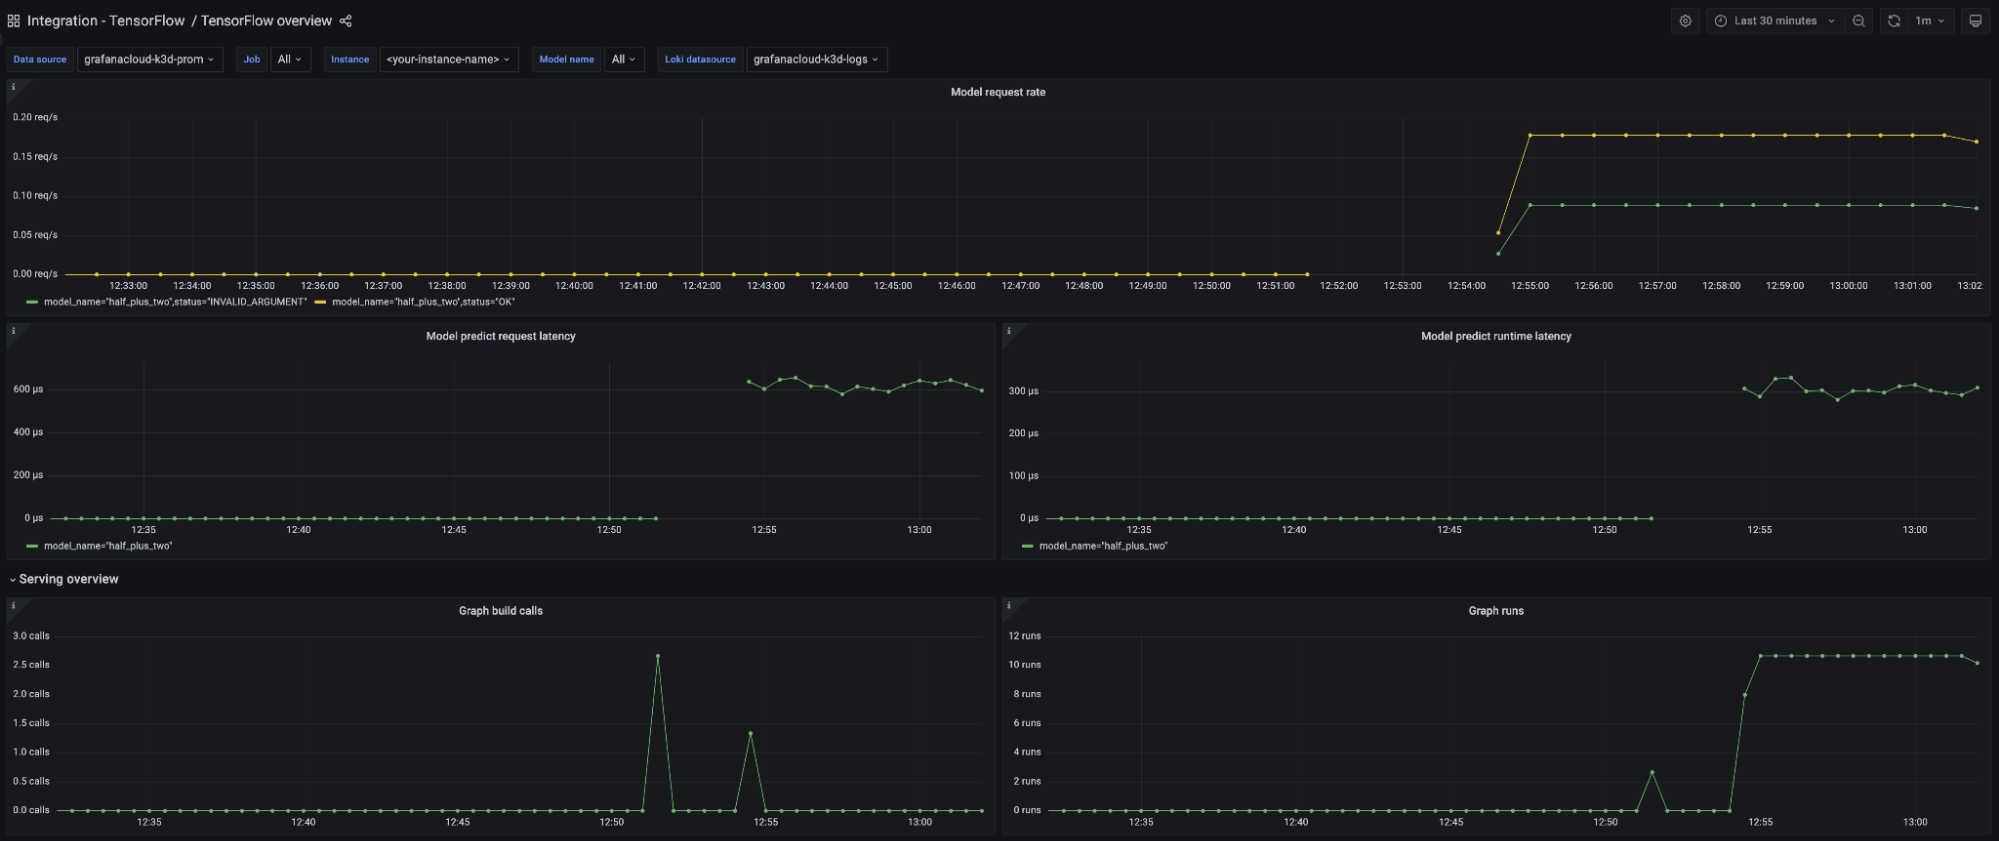

Key metrics
:tensorflow:core:graph_build_calls
:tensorflow:core:graph_build_time_usecs
:tensorflow:core:graph_run_time_usecs
:tensorflow:core:graph_runs
:tensorflow:serving:batching_session:queuing_latency_count
:tensorflow:serving:batching_session:queuing_latency_sum
:tensorflow:serving:request_count
:tensorflow:serving:request_latency_count
:tensorflow:serving:request_latency_sum
:tensorflow:serving:runtime_latency_count
:tensorflow:serving:runtime_latency_sum
Key alerting rules included
TensorFlowModelRequestHighErrorRate
TensorFlowServingHighBatchQueuingLatency