How to observe your TensorFlow Serving instances with Grafana Cloud
The world of AI and machine learning has evolved at an accelerated pace these past few years, and the advent of ChatGPT, DALL-E, and Stable Diffusion has brought a lot of additional attention to the topic. Being aware of this, Grafana Labs prepared an integration for monitoring one of the most used machine learning model servers available: TensorFlow Serving.
TensorFlow Serving is an open source, flexible serving system built to support the use of machine learning models at scale. It takes out the complexity of exposing AI models for consumption over APIs for production environments, providing features like model versioning, automatic request batching, support for canary deployments, and A/B testing, amongst others.
Let me guide you through the details of how to start using this solution to make monitoring your AI environment a pleasing and easy task.
How to configure TensorFlow Serving with Grafana Cloud
This integration relies on TensorFlow Serving’s built-in Prometheus metrics server to generate telemetry data. You can start monitoring your deployment with Grafana Cloud by following these simple steps:
- Log into your Grafana Cloud account, which is required to use the TensorFlow Serving integration. If you don’t have a Grafana Cloud account, you can sign up for a free account today.
- Enable metrics generation and batching in your TensorFlow Serving instance.
- Install the TensorFlow Serving Integration and configure the Grafana Agent to collect logs and metrics from it. Please refer to our how to install and manage integrations documentation for more information. For details around configuring Grafana Agent for this integration, refer to TensorFlow Serving integration documentation.
Start monitoring your TensorFlow Serving instance
After the integration is installed, you will see two pre-built dashboards for TensorFlow Serving and a set of TensorFlow Serving-related alerts automatically installed into your Grafana Cloud account.
TensorFlow Serving overview dashboard
This dashboard gives a general overview of the TensorFlow Serving instance based on all the metrics exposed by the embedded Prometheus server.
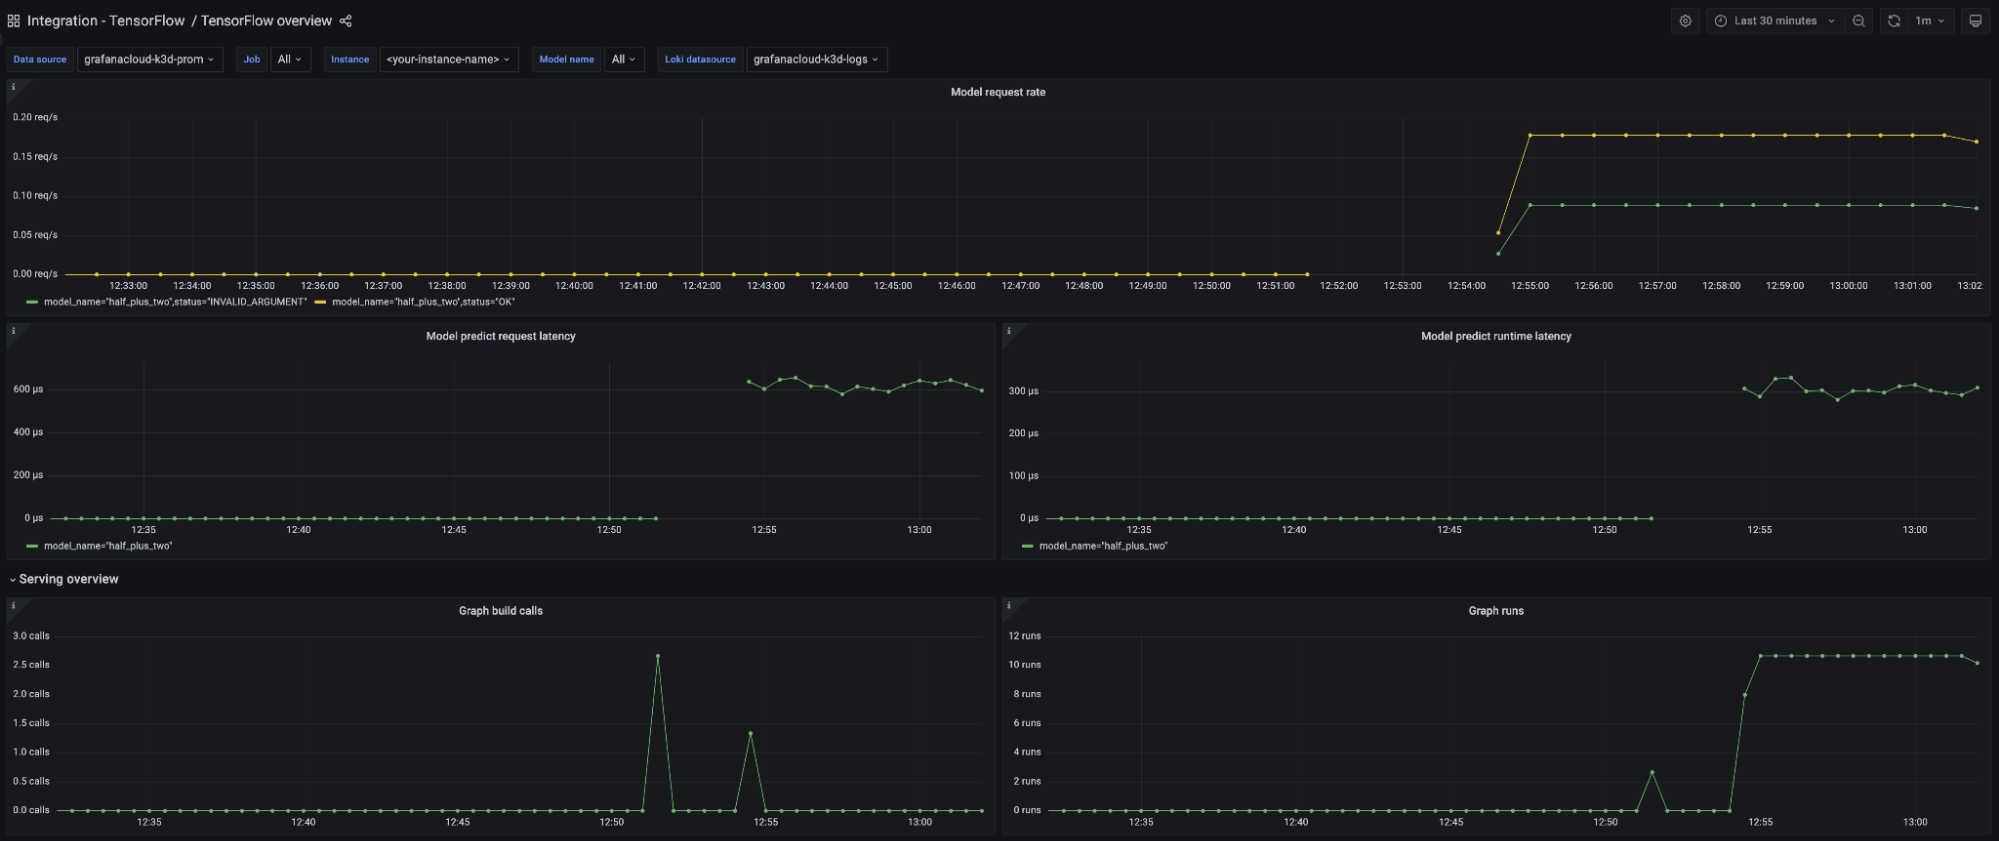
The key metrics monitored are the following:
- Model request rate (
:tensorflow:serving:request_count) - Model request latency (
:tensorflow:serving:request_latency_count) - Model runtime latency (
:tensorflow:serving:runtime_latency_count) - Graph runs (
:tensorflow:core:graph_runs) - Batch queue latency and throughput (
:tensorflow:serving:batching_session:queuing_latency_count)
You can also check your TensorFlow instance logs directly from the dashboard.

TensorFlow Serving alerts
The integration also comes packaged with two handy alerts.

TensorFlowModelRequestHighErrorRate
This alert monitors the tensorflow:serving:request_count metric and alerts with Critical severity if there were more than 30% of requests with a status different than OK over the last 5 minutes. This would mean a problem with your model serving or in the requests themselves.
TensorFlowServingHighBatchQueuingLatency
This alert monitors the tensorflow:serving:batching_session:queuing_latency metrics rate and alerts with Warning severity level if it is above 5000000µs over the last 5 minutes. This would be a bottleneck in model serving, causing latency on the responses.
All alerts thresholds are default examples and can be configured to meet the needs of your environment.
Start monitoring TensorFlow Serving today
These dashboards and alerts can help you get your TensorFlow Serving monitoring up and running in an easy way, which is the goal of this integration.
Give our TensorFlow Serving integration a try, and let us know what you think! You can reach out to us in our Grafana Labs Community Slack in the #Integrations channel.
And if you’re looking to monitor additional environments, check out our solutions page for a list of other tools and platforms we can help you visualize and monitor with Grafana Cloud. At Grafana Labs, we have a “big tent” philosophy of providing a consistent experience across as many data sources and environments as possible, and we’re continuing to expand our integrations to support our community’s needs.
Grafana Cloud is the easiest way to get started with metrics, logs, traces, and dashboards. We have a generous forever-free tier and plans for every use case. Sign up for free now!