
Postgres Exporter
On this page:
Introduction
The following quickstart provides setup instructions and preconfigured dashboards and alerting rules for the Postgres Exporter. After running through the steps in this quickstart, you will have:
Set up and configured Postgres Exporter to collect Postgres metrics like queries per second (QPS) and rows fetched/returned/inserted/updated/deleted per second. Postgres Exporter will expose these as Prometheus-style metrics.
Configured Prometheus to scrape Postgres Exporter metrics and optionally ship them to Grafana Cloud.
Imported Grafana dashboards to visualize your metrics data.
Set up Prometheus alerting rules to alert on your metrics data.
Metrics usage
This exporter publishes roughly 450 Prometheus time series by default. To see a list of metrics shipped by default with this exporter, please download a sample metrics scrape here.
Note that depending on its configuration, Postgres Exporter may collect and publish far more metrics than this default set. To learn more about configuring Postgres Exporter and toggling its collectors, please see the Postgres Exporter GitHub repository.
Beyond toggling Postgres Exporter’s settings, you can reduce metrics usage by dropping time series you don’t need to store in Prometheus or Grafana Cloud. To learn how to do this, please see Reducing Prometheus metrics usage with relabeling from the Grafana Cloud docs.
Grafana Cloud’s Postgres Exporter Integration
If you’re using Grafana Cloud, you can skip all of the steps in this guide by installing the Postgres Exporter Integration, which is designed to help you get up and running in a few commands and clicks. Sign up for free.
To learn how to set up Postgres Exporter using the Postgres Exporter Integration, please see Postgres Exporter Integration from the Grafana Cloud docs.
On this page:
Postgres Exporter Quickstart
In this guide you’ll learn how to set up and configure the Postgres Exporter to collect Postgres metrics like queries per second (QPS), database deadlocks and conflicts, and expose them as Prometheus-style metrics. You’ll then configure Prometheus to scrape Postgres metrics and optionally ship them to Grafana Cloud. Finally, you’ll set up a preconfigured and curated set of Grafana dashboards and alerting rules. At the end of this guide you’ll have dashboards that you can use to visualize your Postgres metrics, and set of preconfigured alerts.
If you’re using Grafana Cloud, the Postgres Integration can help you get up and running quickly. The Postgres Integration embeds the Postgres Exporter into the Grafana Cloud Agent and automatically provisions alerting rules and dashboards, so you don’t have to run through the steps in this guide. To learn how to set up Postgres Exporter using the Postgres Integration, please see Postgres Integration from the Grafana Cloud docs.
Prerequisites
Before you get started, you should have the following available to you:
- A machine compatible with a Postgres Exporter release. To see a list of available releases, please see Releases.
- Postgres running on your machine. To learn more about installing and running Postgres, please see the Postgres Installation Guide.
- Prometheus running in your environment or directly on the machine. To learn how to install Prometheus, please see Installation from the Prometheus docs.
- Grafana running in your environment or directly on the machine. To learn how to install Grafana, please see Install Grafana from the Grafana docs.
- (Optional) A Grafana Cloud account. Grafana Cloud hosts Grafana and a Mimir-based Prometheus metrics endpoint. You will still need to scrape metrics, using either Prometheus installed in your environment, or the Grafana Cloud Agent. To learn more about Grafana Cloud, please see Grafana Cloud.
Step 1: Setting up Postgres Exporter
In this step you’ll set up the Postgres exporter on your machine to collect and expose Postgres metrics in Prometheus format. This guide uses an Ubuntu 20.04 system with Postgres 13.2. Steps may vary slightly depending on your operating system and Postgres version.
To begin, log in to your machine and download the relevant Postgres Exporter binary. This guide uses the linux-amd64 binary but you should choose the one corresponding to your system’s OS and architecture:
wget https://github.com/prometheus-community/postgres_exporter/releases/download/v0.9.0/postgres_exporter-0.9.0.linux-amd64.tar.gzReplace v0.9.0 with the version you’d like to install. This guide may become stale so it’s best to check the Postgres Exporter Releases page for the latest stable version.
Unzip the tarball and cd into the directory:
tar xvfz postgres_exporter-*.linux-amd64.tar.gz
cd postgres_exporter-*.linux-amd64We’ll be running the Postgres exporter as the postgres user to fetch database metrics. To fetch metrics as a non-superuser, you can follow the instructions from the Postgres Exporter Github Repo.
We need to inform the exporter how to reach the Postgres server. We do that by setting the following environment variable:
export DATA_SOURCE_NAME='postgresql://postgres:enter_password_here@postgres_hostname:5432/postgres?sslmode=disable'Be sure to replace postgres with the user you will be using to fetch metrics from Postgres, enter_password_here with the password for your user, and postgres_hostname with the hostname of the Postgres instance (localhost if you’re on the same machine).
Finally, run the exporter:
./postgres_exporter
INFO[0000] Starting Server: :9187 source="postgres_exporter.go:1850"If you see the above output, you successfully ran Postgres Exporter.
Postgres Exporter publishes Postgres metrics in Prometheus format on port 9187. You can test this using curl. You will need to open a new SSH session or background the Postgres Exporter process to use curl.
curl http://localhost:9187/metrics# TYPE pg_exporter_scrapes_total counter
pg_exporter_scrapes_total 1
# HELP pg_locks_count Number of locks
# TYPE pg_locks_count gauge
pg_locks_count{datname="postgres",mode="accessexclusivelock",server="localhost:5432"} 0
pg_locks_count{datname="postgres",mode="accesssharelock",server="localhost:5432"} 1
pg_locks_count{datname="postgres",mode="exclusivelock",server="localhost:5432"} 0
pg_locks_count{datname="postgres",mode="rowexclusivelock",server="localhost:5432"} 0
pg_locks_count{datname="postgres",mode="rowsharelock",server="localhost:5432"} 0
pg_locks_count{datname="postgres",mode="sharelock",server="localhost:5432"} 0
pg_locks_count{datname="postgres",mode="sharerowexclusivelock",server="localhost:5432"} 0
pg_locks_count{datname="postgres",mode="shareupdateexclusivelock",server="localhost:5432"} 0
pg_locks_count{datname="postgres",mode="sireadlock",server="localhost:5432"} 0If you see the above output, you’re ready to begin scraping Postgres metrics using Prometheus.
To avoid running and managing Postgres Exporter from the command line, you can create a systemd service. To learn how to do this, please see Creating a systemd service to manage the agent. Replace the path to the agent binary with the path to Postgres Exporter.
You can specify the --extend.query-path flag to the path of your queries.yaml file, where you can specify your custom queries. To learn more about these features, please see the Postgres Exporter GitHub repository.
Step 2: Scraping Postgres Exporter using Prometheus
Now that the Postgres Exporter is up and running on your machine, you can configure a Prometheus scrape job to collect and store Postgres Exporter metrics.
Add the following scrape job config to the scrape_configs section of your prometheus.yml configuration file:
- job_name: postgres
  static_configs:
- targets: ['postgres_exporter_machine_IP_address:9187']Replace postgres_exporter_machine_IP_address with the IP address of the machine running Postgres Exporter. If you’re running Prometheus on the same machine, this will be localhost. To learn more about configuring Prometheus, please see Configuration from the Prometheus docs.
If you don’t have a prometheus.yml configuration file, create a simple one using your favorite text editor. Open your preferred text editor and paste in the following Prometheus configuration:
global:
  scrape_interval: 15s

scrape_configs:
- job_name: postgres
  static_configs:
- targets: ['postgres_exporter_machine_IP_address:9187']This configuration tells Prometheus to scrape all jobs every 15 seconds. The only configured scrape job is called postgres and defines a postgres_exporter_machine_IP_address:9187 target. By default, Prometheus will scrape the /metrics endpoint using HTTP.
Save and close the file. You can then run Prometheus with the file using the following command:
./prometheus --config.file=./prometheus.ymlShipping metrics to Grafana Cloud
To ship Postgres Exporter metrics to Grafana Cloud from Prometheus, configure the remote_write parameter in your prometheus.yml configuration file. To learn more, please see Metrics — Prometheus from the Grafana Cloud docs. To learn more about the remote_write parameter, please see remote_write from the Prometheus docs.
Step 3: Configuring dashboards
This quickstart includes one dashboard:
- Postgres Overview
To learn how to import these dashboards into Grafana, please see Importing a dashboard from the Grafana docs.
You can fetch the dashboards here.
Step 4: Configuring alerts
With Prometheus alerting rules, you can define alerts that fire when PromQL expressions breach some threshold or satisfy specified conditions over a period of time. For example, you can define a HighRequestLatency alert that fires when a request latency metric is greater than some threshold over a period of time. As soon as the alerting condition is triggered, the alert moves into Pending state. After satisfying the condition for the period of time defined by the for parameter, the alert moves into Firing state. You can configure routing and notifications for firing alerts using a tool like Alertmanager. Alertmanager is also built-in to Grafana Cloud.
You can fetch the alerting rule YAML file here.
Load alerting rules into Prometheus
To load alerting rules into Prometheus, add the following to your prometheus.yml configuration file:
rule_files:
- "postgres_exporter_alerting_rules.yml"Be sure to replace postgres_exporter_alerting_rules.yml with the path to your Postgres alerting rules YAML file.
Load alerting rules into Grafana Cloud
To learn how to load alerting rules into Grafana Cloud, please see Prometheus and Loki rules with cortextool.
Conclusion
In this quickstart you installed and ran Postgres Exporter on your Linux machine. You then configured Prometheus to scrape the database and Postgres metrics exposed by Postgres Exporter. You loaded alerting rules into Prometheus, and finally imported Grafana dashboards to visualize your Postgres metrics.
If you’re using Grafana Cloud, you can skip all of the steps in this guide by installing the Postgres integration with the Grafana Cloud Agent. This integration embeds a preconfigured Postgres Exporter into the agent and automatically provisions Grafana dashboards and Prometheus alerting and recording rules, so you don’t have to import them manually. To learn how to set up the Postgres integration, please see Grafana Cloud Integrations.
The dashboards, recording rules, and alerting rules were generated using the Postgres Exporter Mixin. Mixins are reusable templates for dasboards, recording rules, and alerts curated and designed by subject matter experts. To learn more, please see the Postgres Mixin repository.
On this page:
Postgres Overview Dashboard
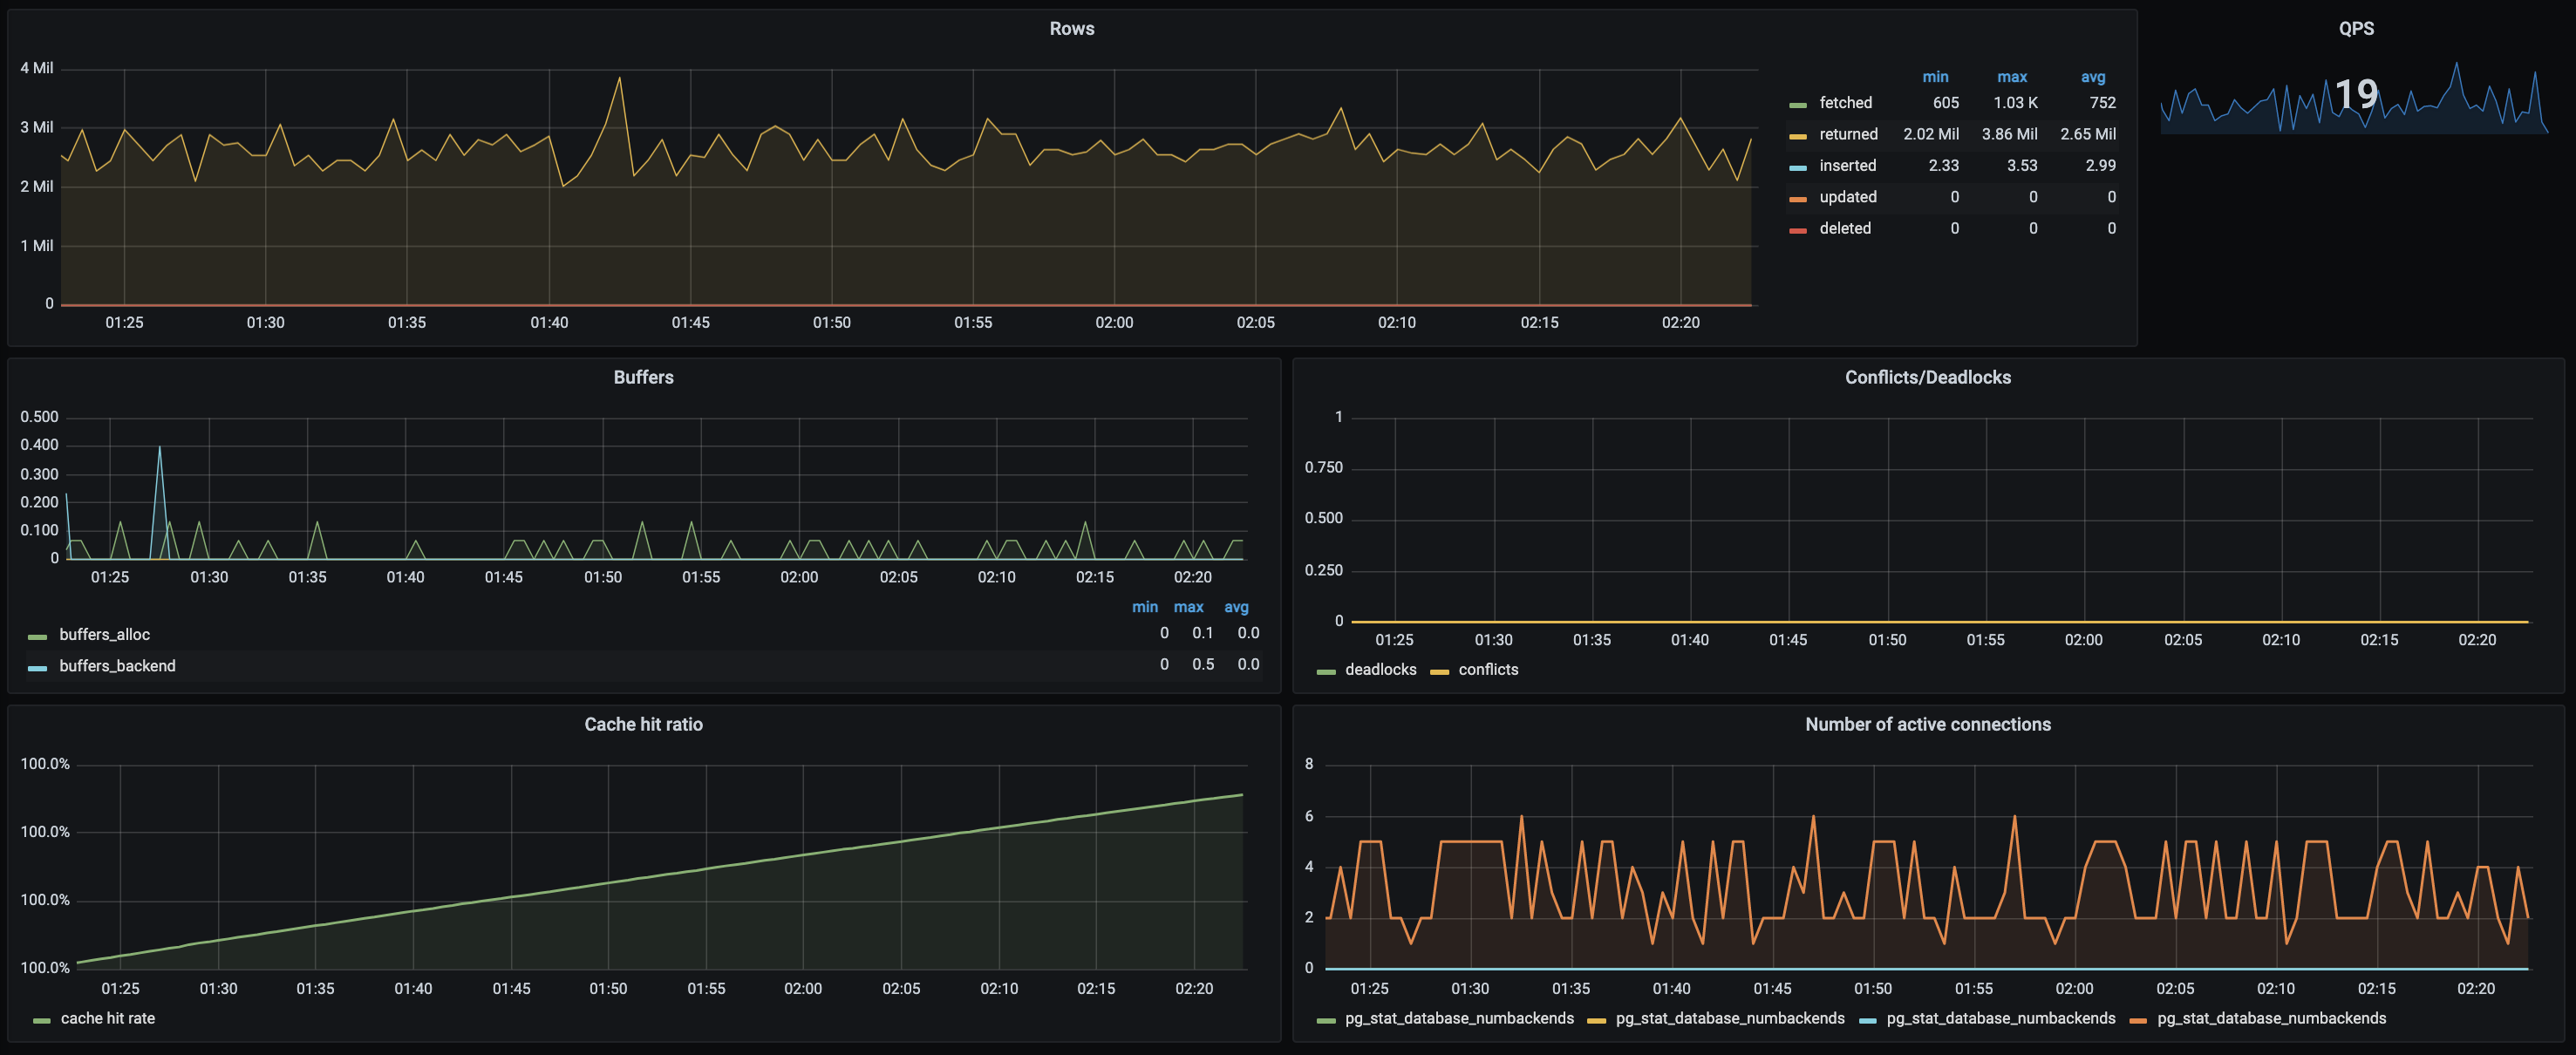
This dashboard includes panels for the following metrics:
- Current QPS
- Fetched, Returned, Inserted, Updated, Deleted Rows
- Database Deadlocks and Conflicts
- Cache Hit Ratio
- Number of Active Connections
- Buffers
You can import the dashboard directly using the following dashboard ID: 14114.
You can fetch the dashboard JSON here.
This dashboard was generated using the Postgres Exporter mixin.
On this page:
This quickstart includes the following alerting rules:
PostgreSQLMaxConnectionsReached
Postgres ran out of available connections
PostgreSQLHighConnections
Postgres is exceeding 80% of the currently configured maximum Postgres connection limit
PostgreSQLDown
Postgres is not processing queries
PostgreSQLSlowQueries
Postgres has high number of slow queries
PostgreSQLQPS
Postgres has high number of queries per second
PostgreSQLCacheHitRatio
Postgres is low on cache hit rate
Download the following alerting rules YAML filegroups:
- name: PostgreSQL
rules:
- alert: PostgreSQLMaxConnectionsReached
expr: sum(pg_stat_activity_count) by (instance) >= sum(pg_settings_max_connections) by (instance) - sum(pg_settings_superuser_reserved_connections) by (instance)
for: 1m
labels:
severity: email
annotations:
summary: "{{ $labels.instance }} has maxed out Postgres connections."
description: "{{ $labels.instance }} is exceeding the currently configured maximum Postgres connection limit (current value: {{ $value }}s). Services may be degraded - please take immediate action (you probably need to increase max_connections in the Docker image and re-deploy."
- alert: PostgreSQLHighConnections
expr: sum(pg_stat_activity_count) by (instance) > (sum(pg_settings_max_connections) by (instance) - sum(pg_settings_superuser_reserved_connections) by (instance)) * 0.8
for: 10m
labels:
severity: email
annotations:
summary: "{{ $labels.instance }} is over 80% of max Postgres connections."
description: "{{ $labels.instance }} is exceeding 80% of the currently configured maximum Postgres connection limit (current value: {{ $value }}s). Please check utilization graphs and confirm if this is normal service growth, abuse or an otherwise temporary condition or if new resources need to be provisioned (or the limits increased, which is mostly likely)."
- alert: PostgreSQLDown
expr: pg_up != 1
for: 1m
labels:
severity: email
annotations:
summary: "PostgreSQL is not processing queries: {{ $labels.instance }}"
description: "{{ $labels.instance }} is rejecting query requests from the exporter, and thus probably not allowing DNS requests to work either. User services should not be effected provided at least 1 node is still alive."
- alert: PostgreSQLSlowQueries
expr: avg(rate(pg_stat_activity_max_tx_duration{datname!~"template.*"}[2m])) by (datname) > 2 * 60
for: 2m
labels:
severity: email
annotations:
summary: "PostgreSQL high number of slow on {{ $labels.cluster }} for database {{ $labels.datname }} "
description: "PostgreSQL high number of slow queries {{ $labels.cluster }} for database {{ $labels.datname }} with a value of {{ $value }} "
- alert: PostgreSQLQPS
expr: avg(irate(pg_stat_database_xact_commit{datname!~"template.*"}[5m]) + irate(pg_stat_database_xact_rollback{datname!~"template.*"}[5m])) by (datname) > 10000
for: 5m
labels:
severity: email
annotations:
summary: "PostgreSQL high number of queries per second {{ $labels.cluster }} for database {{ $labels.datname }}"
description: "PostgreSQL high number of queries per second on {{ $labels.cluster }} for database {{ $labels.datname }} with a value of {{ $value }}"
- alert: PostgreSQLCacheHitRatio
expr: avg(rate(pg_stat_database_blks_hit{datname!~"template.*"}[5m]) / (rate(pg_stat_database_blks_hit{datname!~"template.*"}[5m]) + rate(pg_stat_database_blks_read{datname!~"template.*"}[5m]))) by (datname) < 0.98
for: 5m
labels:
severity: email
annotations:
summary: "PostgreSQL low cache hit rate on {{ $labels.cluster }} for database {{ $labels.datname }}"
description: "PostgreSQL low on cache hit rate on {{ $labels.cluster }} for database {{ $labels.datname }} with a value of {{ $value }}"This alerting rule YAML file was generated using the Postgres Exporter mixin.
On this page:
Grafana Cloud comes with an ever-expanding set of integrations to quickly get an observability stack up and running in minutes. The Postgres Integration, built-in to the Grafana Cloud Agent, exposes and scrapes essential Postgres metrics and pushes them to Grafana Cloud. The agent will scrape metrics using an embedded Postgres Exporter, and Grafana Cloud will automatically provision tailored Grafana dashboards and alerts for visualizing and acting on this data.
To learn more, check out the Grafana Cloud docs.
How it works
Configuring, installing, connecting, and maintaining Prometheus monitoring components typically involves significant domain knowledge. It can take quite a while to go from setup to dashboard and alerts. As the creators of Grafana - and core contributors to Prometheus and Cortex - we build simple integrations to abstract some of this work away in order to quickly get started. How it works:
- Sign up (or log in) for a free Grafana Cloud account.
- Select the target you’d like to observe (an ever-expanding catalogue).
- Run a one-line command to install the Grafana Agent. The agent embeds abnd preconfigures Exporters to expose default metrics, and pushes them to the Grafana Cloud metrics backend.
- Voila! You’ll see tailored Grafana dashboards and will benefit from sane alerting defaults.
Looking for a different Exporter or integration? Check out our growing library of integrations for popular components like MySQL, Postgres, Redis, Memcached and more.