
Jenkins data source
Jenkins is an open source automation server used to build and deploy projects as part of Continuous Integration (CI) and Continuous Deployment (CD) pipelines.
The Jenkins data source plugin allows you to query and visualize metrics such as projects, builds, build queues, nodes and load statistics from within Grafana. This information can be used to measure performance against DORA metrics to assess your software delivery and operations performance.
Requirements
This plugin has the following requirements:
- A Jenkins instance with Remote Access API enabled.
- Access to Enterprise plugins. Note: these plugins are also available in the Free tier of Grafana Cloud. For more information, see our Pricing.
Install the plugin
To install the data source, refer to Installation.
Configure the data source in Grafana
Add a data source by filling in the following fields:
Basic fields
To read more on the Jenkins Remote Access API, visit the documentation
Configure the data source with provisioning
It is possible to configure data sources using configuration files with Grafana’s provisioning system. To read about how it works, including all the settings that you can set for this data source, refer to Provisioning Grafana data sources
Here are some provisioning examples for this data source:
apiVersion: 1
datasources:
  - name: Jenkins
    type: grafana-jenkins-datasource
    jsonData:
      url: https://ci.jenkins.io
      username: <username>
    secureJsonData:
      password: <password>
Query the data source
The Jenkins data source supports a range of query types to help you understand the state of your project builds.
Projects
A project, also known as a job or item, is the core building block in the Jenkins automation server. It holds the configuration for Jenkins to perform specific tasks in CI/CD pipelines, such as building code, running tests, or deploying applications.
The Projects query returns a list of all Jenkins projects with information such as name, URL, current status,
and whether it can be built. You’ll also get details about its first, last, and most recent successful, failed,
or unstable builds, along with information like the next build number and if it’s currently disabled.
Project Builds
A Project Build, or simply build, is a single execution of a configured Jenkins Project. Triggered manually, on schedule, or by code changes, each build independently runs the project’s defined steps, including SCM operations, build commands, and post-build actions.
The Project Builds query returns a list of all project builds with information such as its unique number,
when it started, its display name, and a direct URL to view its results. You’ll also find out if the build
is currently running, its duration, and the estimated time it would take. Crucially, it shows the result of the
build (success or failure) and the agent it ran on.
Build Queue
The Jenkins Build Queue manages and prioritizes build requests waiting for available resources. When a project build is triggered but no executors are free, the request enters this “waiting room.” This ensures builds run in turn, and administrators can track pending tasks and workload.
The Build Queue query returns a list of all builds currently waiting in the build queue. For each build, you’ll see
its unique ID, whether it’s currently buildable or blocked, if it’s been canceled or is stuck, and how long it’s been
in the queue. It also tells you why it’s waiting, the name of the Project it belongs to, and a URL to view more details.
Nodes
A Jenkins Node, also known as an agent or slave, is a machine (physical or virtual) that connects to the main Jenkins server and executes build tasks.
The Nodes query returns a list of all nodes connected to your Jenkins server. For each node, you’ll see its name,
description, assigned labels (for categorizing it), and the number of tasks it can run at once. It also tells you if
the node is idle or offline, and if offline, the reason why.
Node Labels
A Jenkins Node Label is a custom tag or category assigned to a Jenkins Node, allowing you to run specific builds only on nodes that have that label.
Thr Node Labels query returns a list of node labels used to organize your Jenkins nodes. For each label, you’ll see
its name, how many executors (slots for running tasks) are currently busy or idle, and the total number available
under that label. It also indicates if any nodes associated with that label are offline, and lists the names of the
nodes themselves.
Import a dashboard for Jenkins
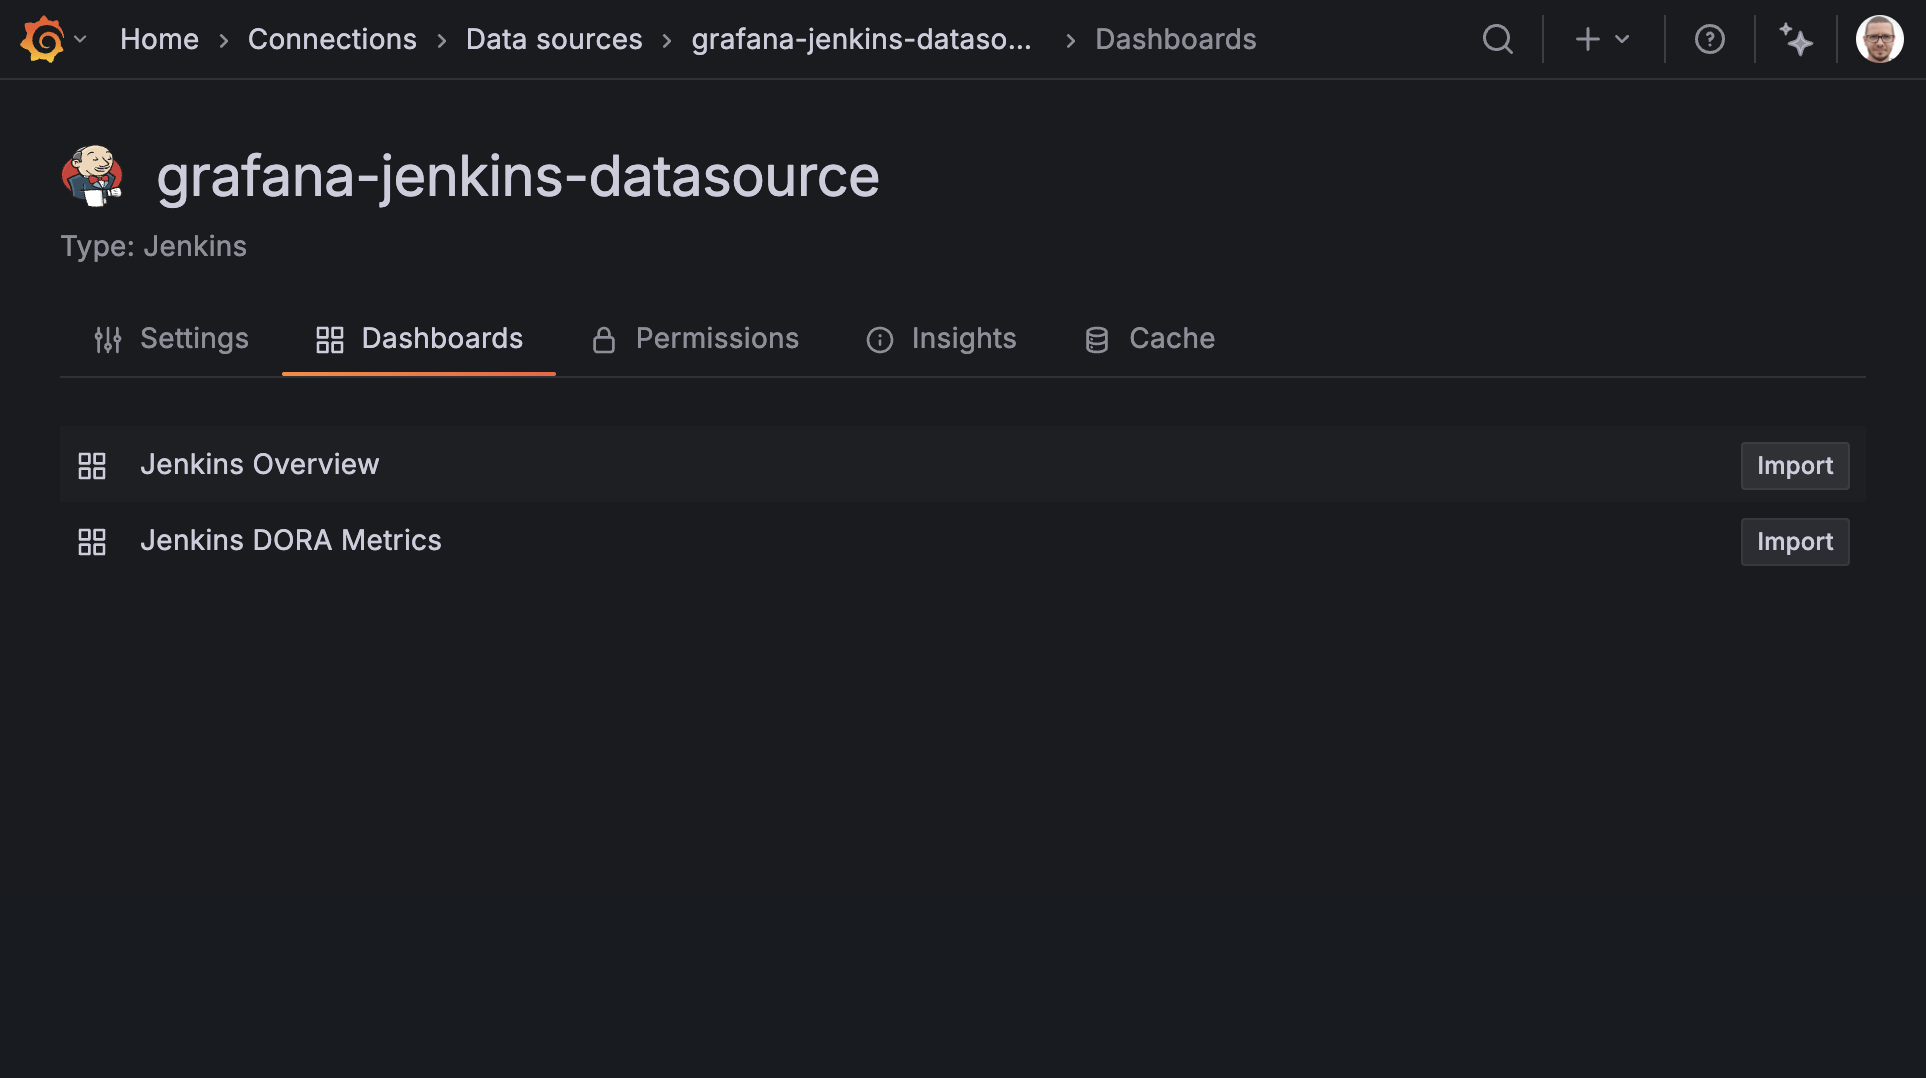
This plugin includes two built-in dashboards to help you quickly get started visualizing Jenkins data.
To import the dashboards, you must first install the plugin and configure a data source.
From the data source configuration page, navigate to the Dashboards tab where you’ll see a list of available dashboards.
Click the Import button next to any dashboard you wish to import.
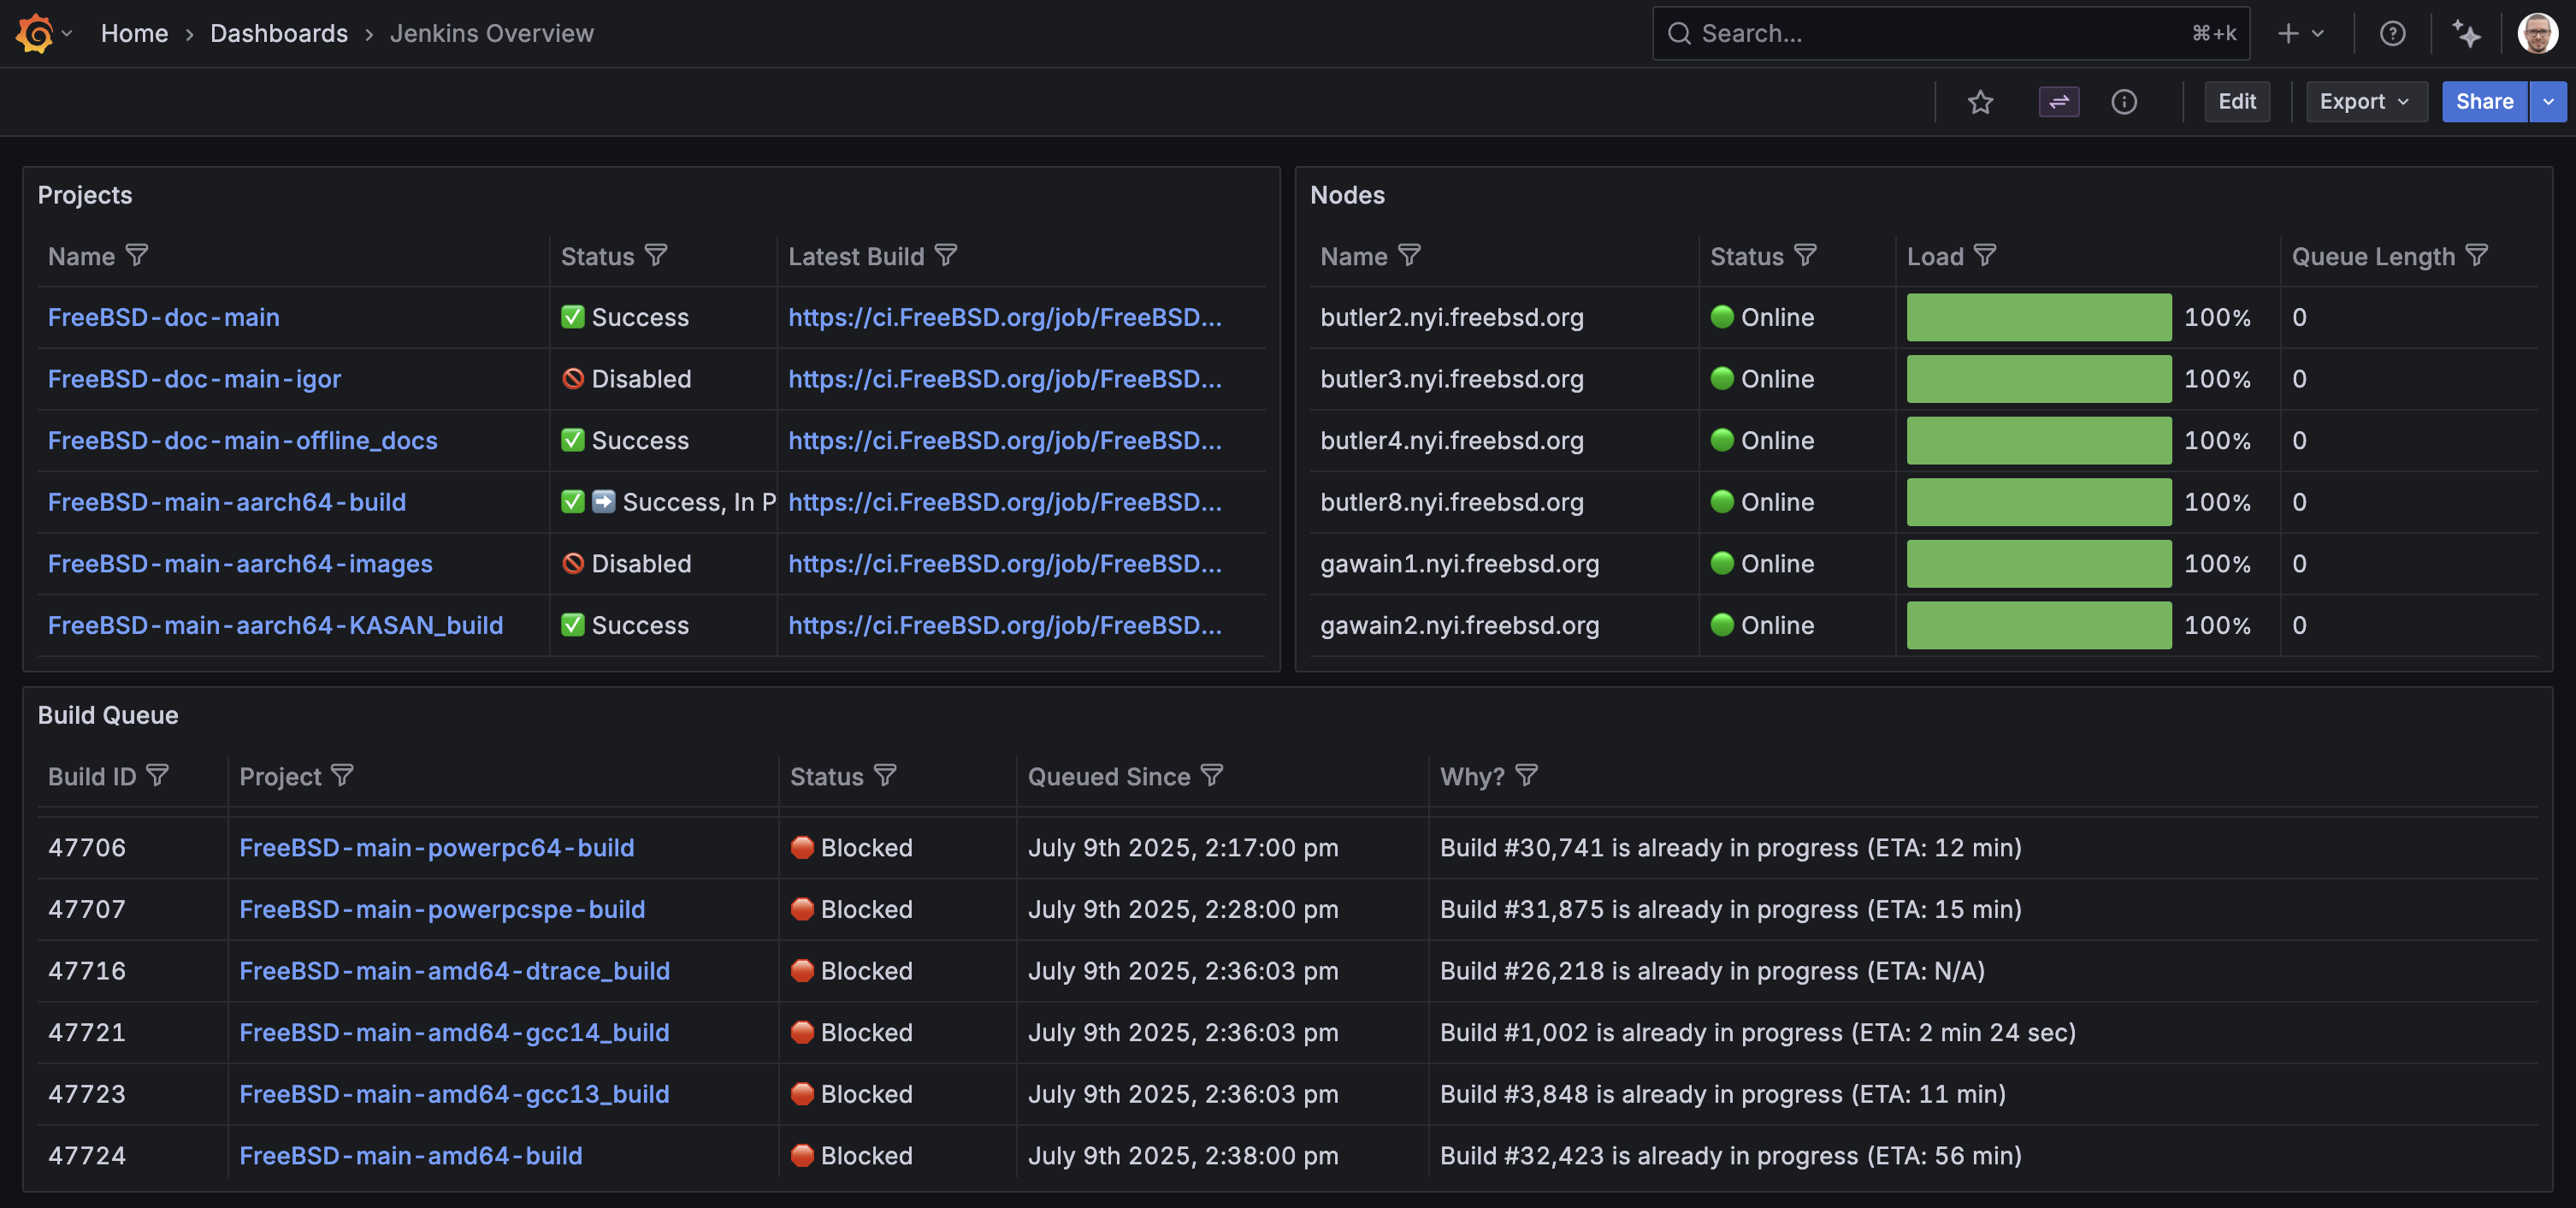
Jenkins Overview
This dashboard provides an overview of the Jenkins instance, including all projects, nodes, executor status and build queue.
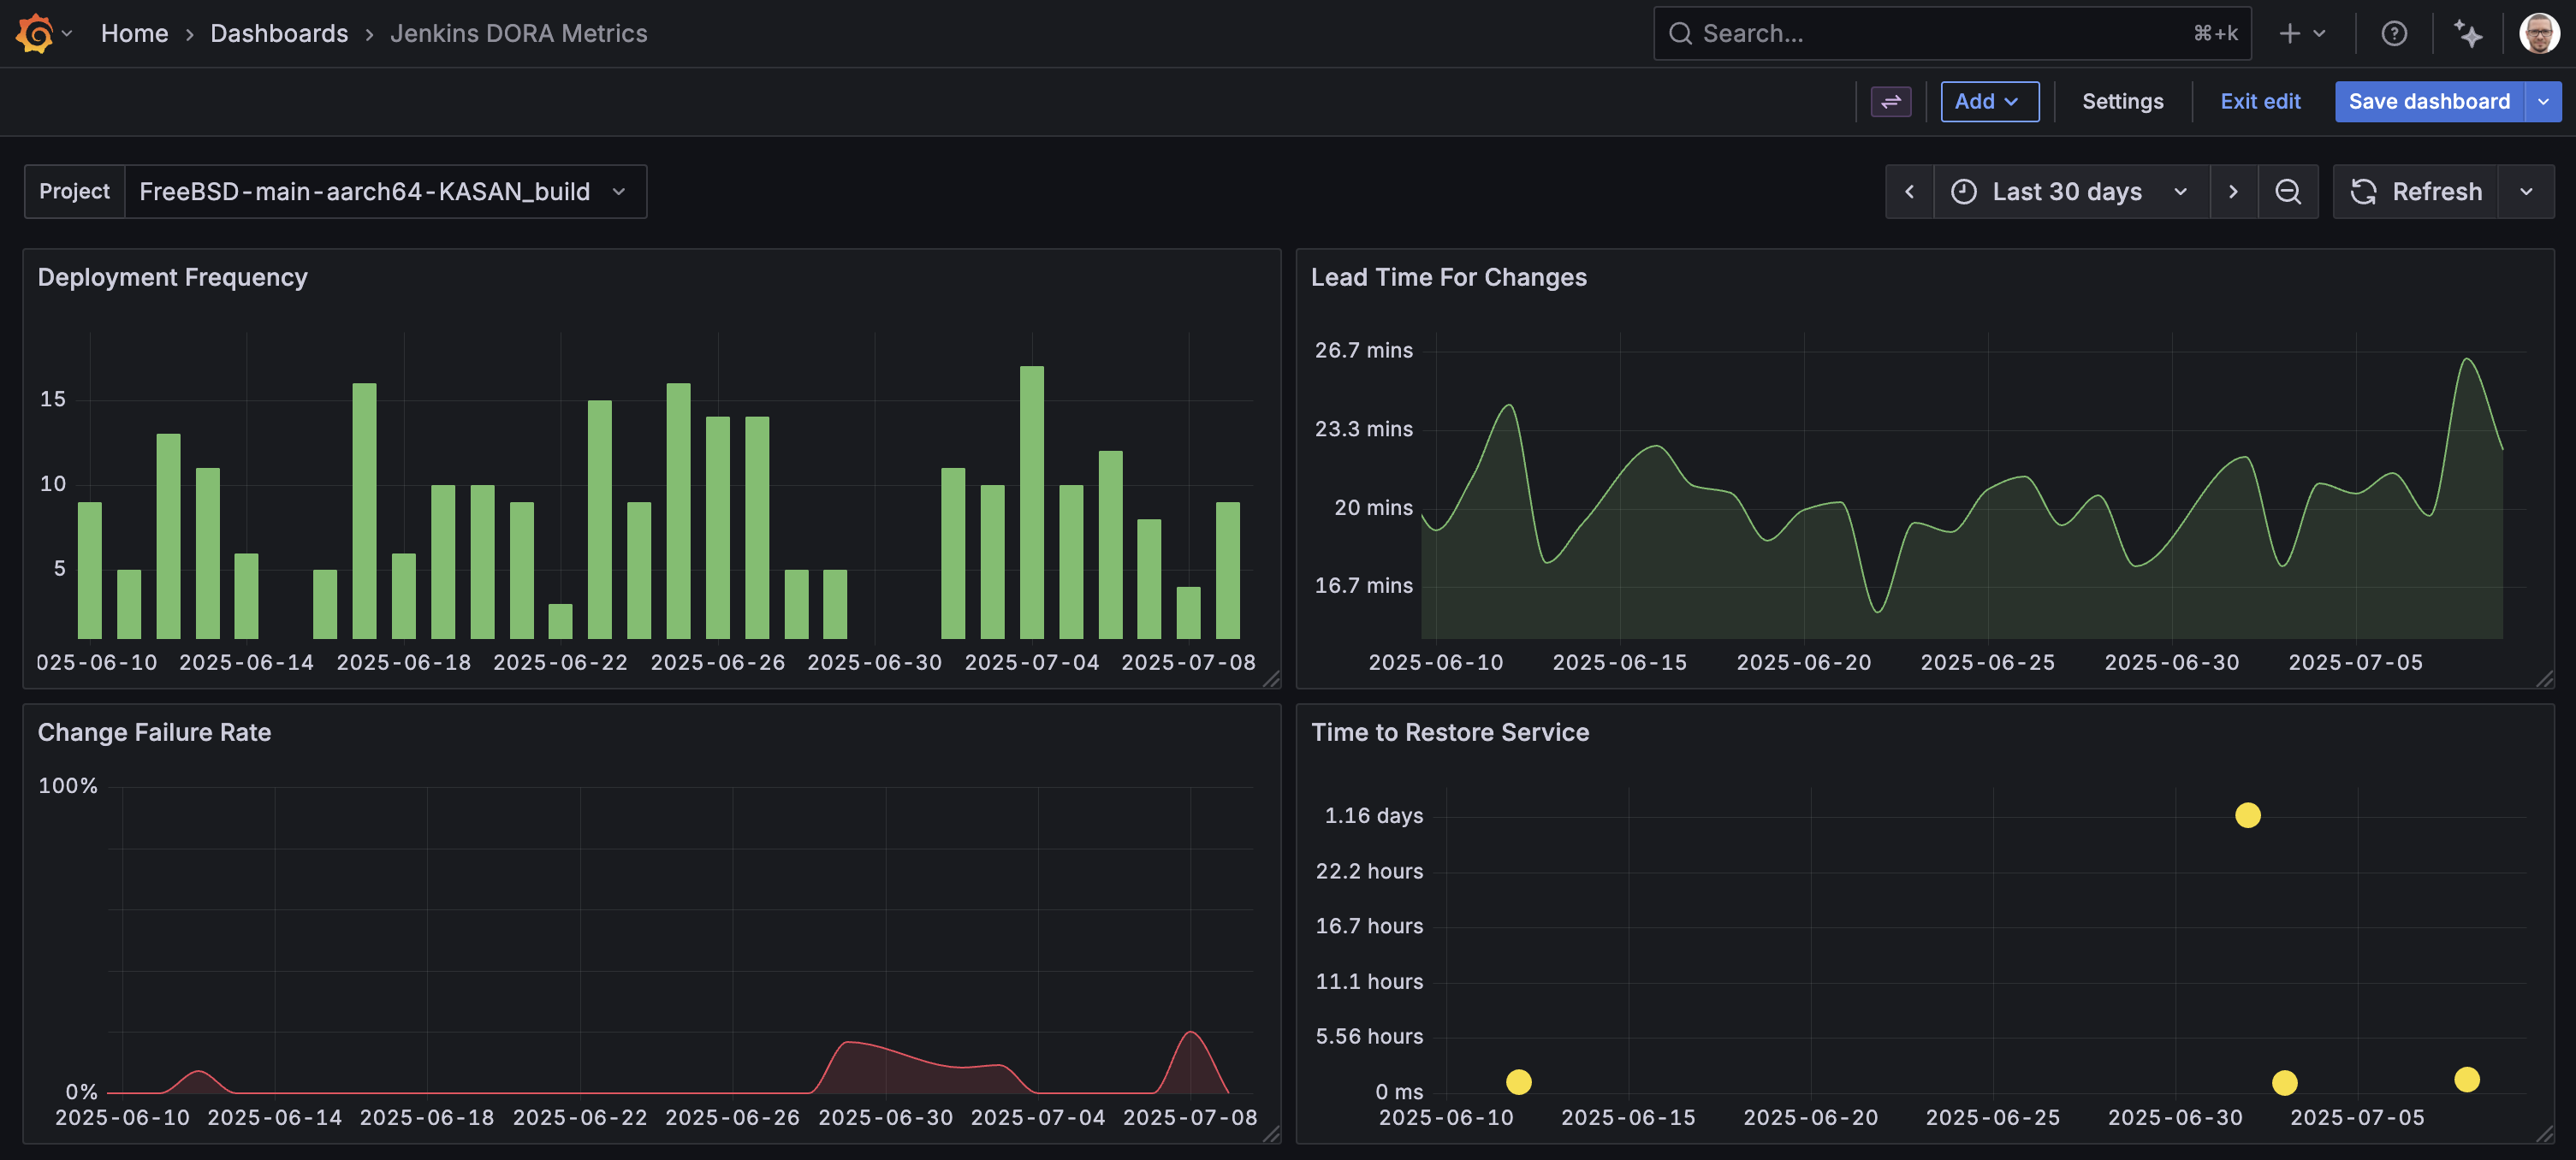
Jenkins DORA Metrics
This dashboard provides information on four key metrics used to assess software development team performance: deployment frequency, lead time for changes, change failure rate and time to restore service. These metrics focus on both the speed and stability of software delivery.
Learn more
- Add Annotations.
- Configure and use Templates and variables.
- Add Transformations.
Was this page helpful?
Related resources from Grafana Labs


