Direct DB Data Source Configuration
Security notes
Grafana-Zabbix plugin can use MySQL, Postgres or InfluxDB (if Zabbix configured to store history data in InfluxDB) data sources to query history and trend data directly from Zabbix database. In order to execute queries, plugin needs only read access to the history, history_uint, trends and trends_uint tables. To make connection more secure and prevent unnecessary data disclosure, it’s highly recommended to grant read access to only that tables. But if you want to use this data source for querying another data, you can
grant SELECT privileges to entire zabbix database. Also, all queries are invoked by grafana server, so you can restrict connection to only grafana host. Here’s MySQL example:
GRANT SELECT ON zabbix.* TO 'grafana'@'grafana-host' identified by 'password';MySQL
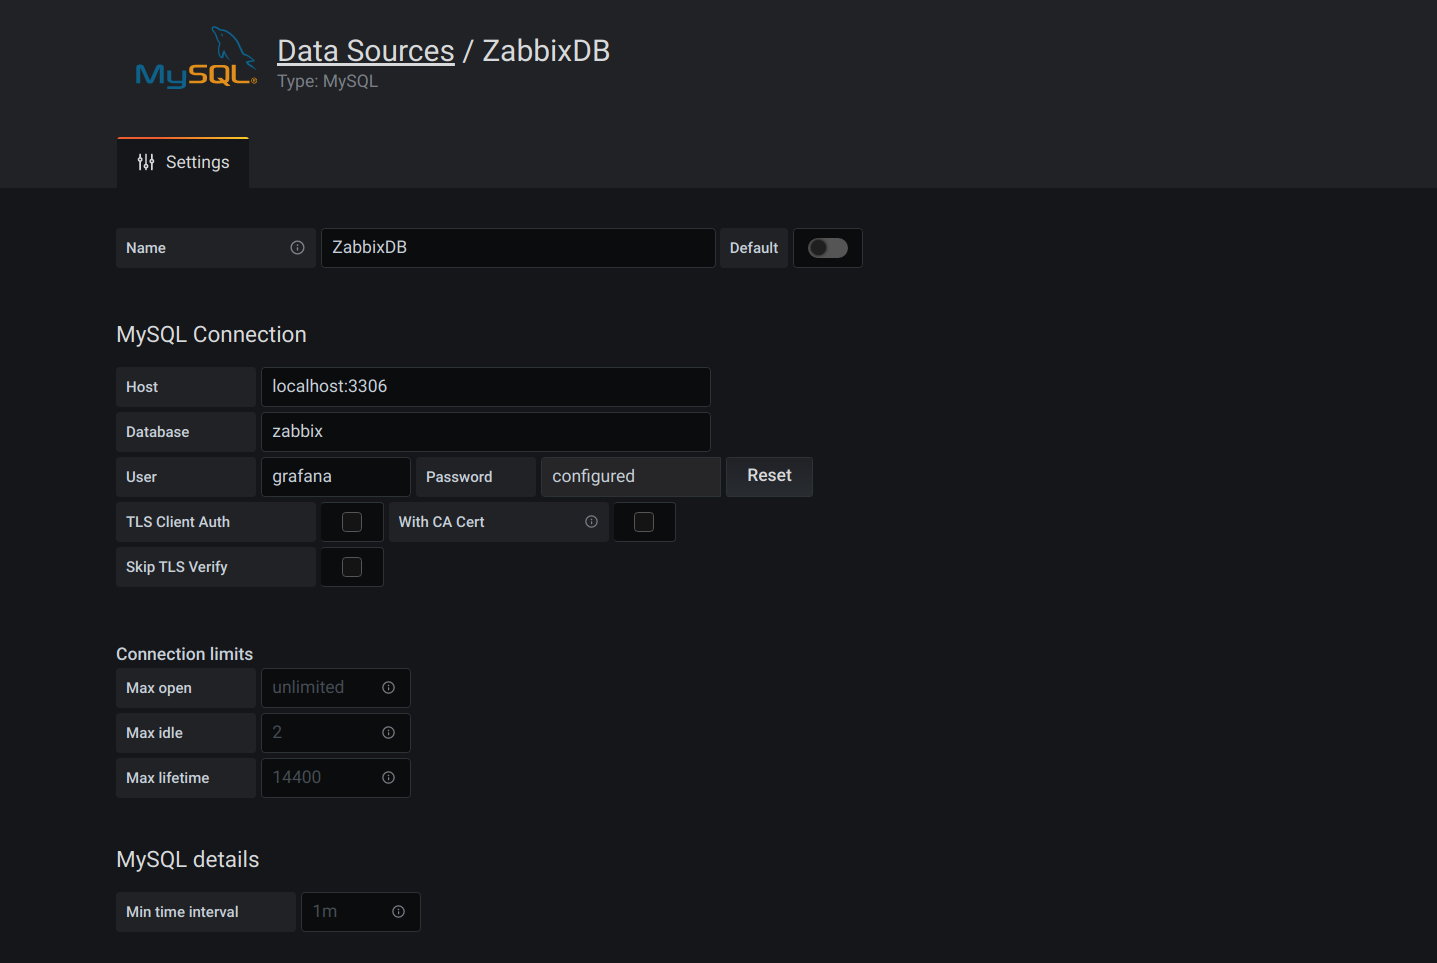
In order to use Direct DB Connection feature you should configure SQL data source first.

Select MySQL data source type and provide your database host address and port (3306 is default for MySQL). Fill
database name (usually, zabbix) and specify credentials.
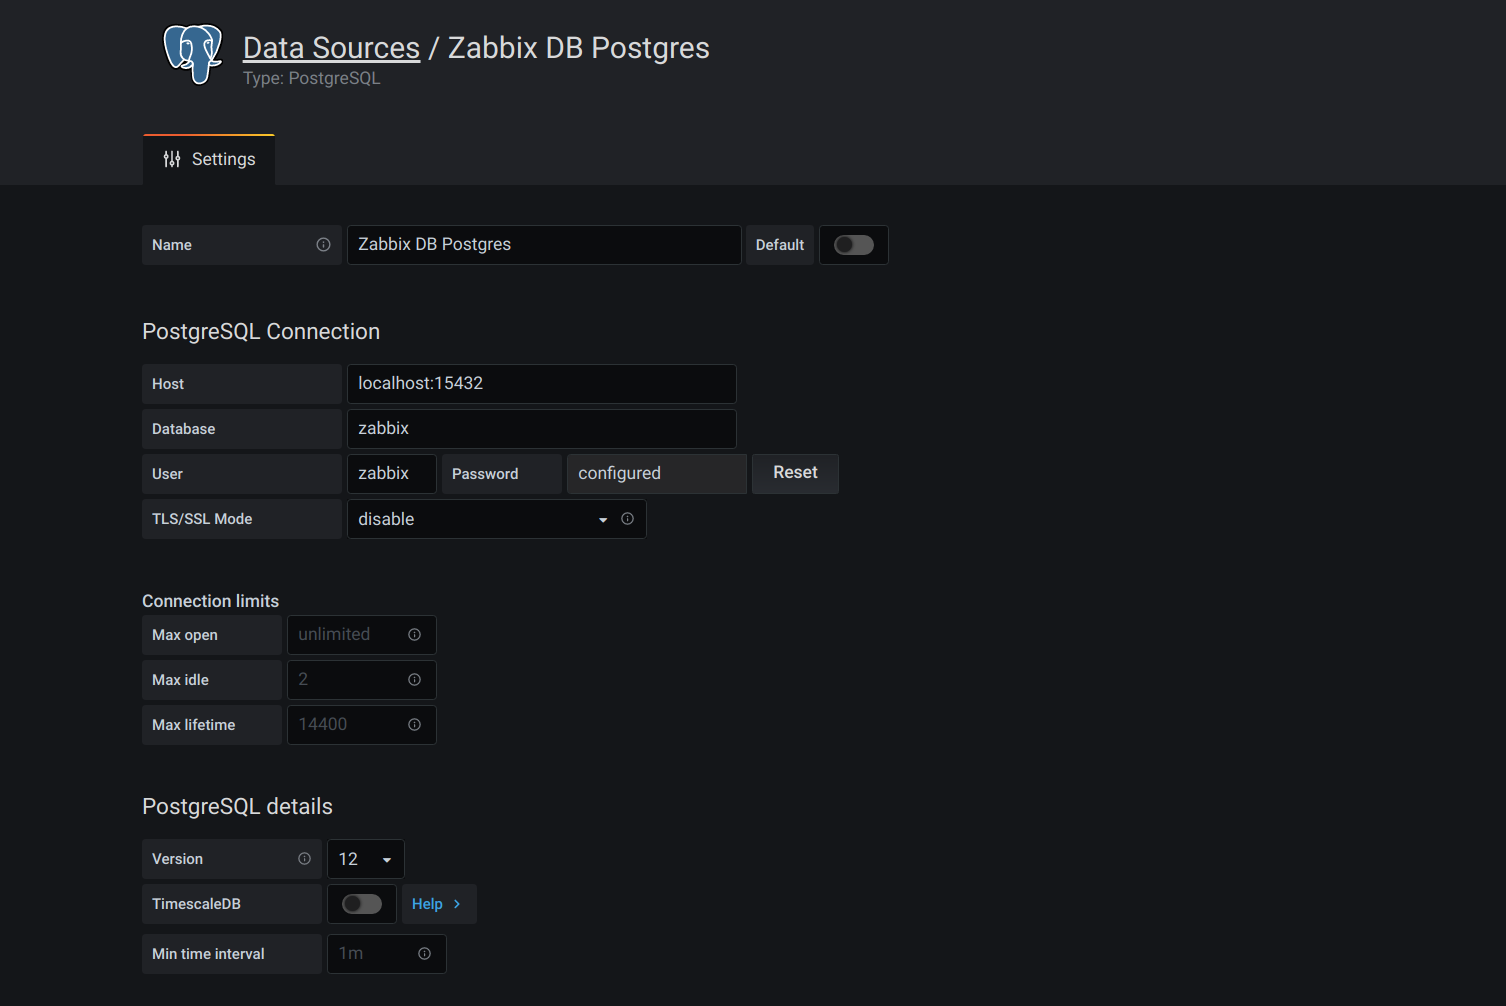
PostgreSQL
Select PostgreSQL data source type and provide your database host address and port (5432 is default). Fill
database name (usually, zabbix) and specify credentials.

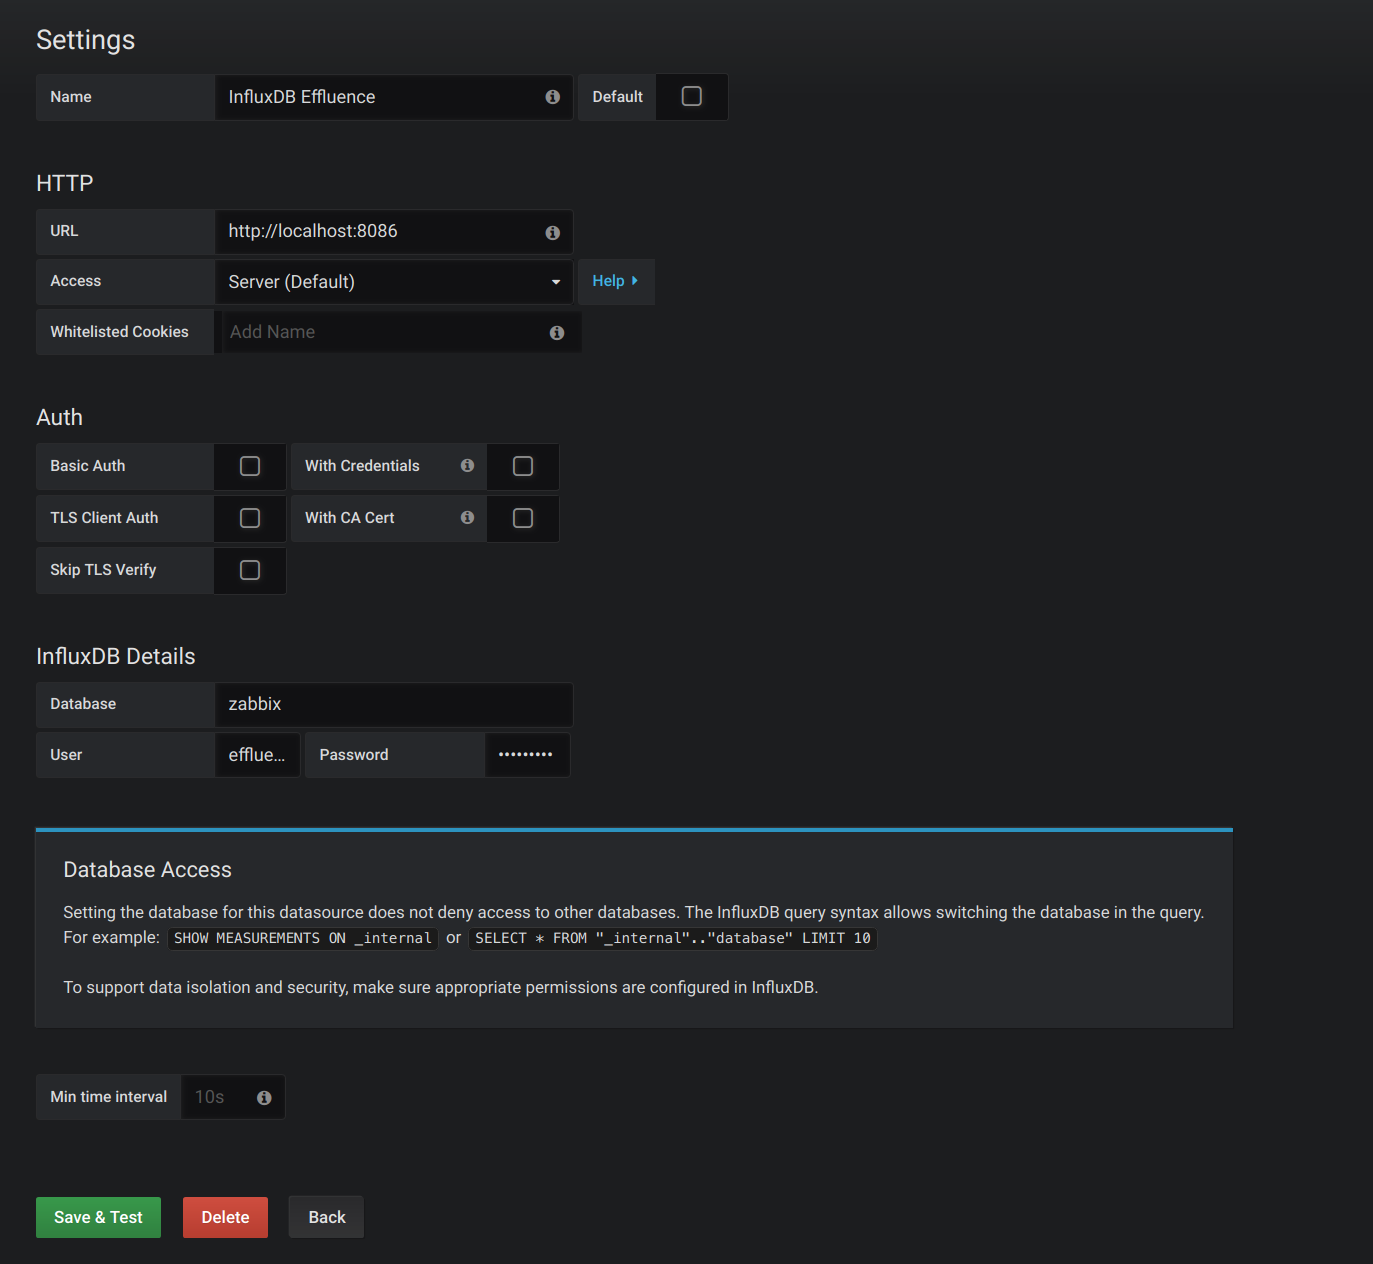
InfluxDB
Select InfluxDB data source type and provide your InfluxDB instance host address and port (8086 is default). Fill
database name you configured in the effluence module config (usually, zabbix) and specify credentials.


